Grab SPAC Presentation Deck
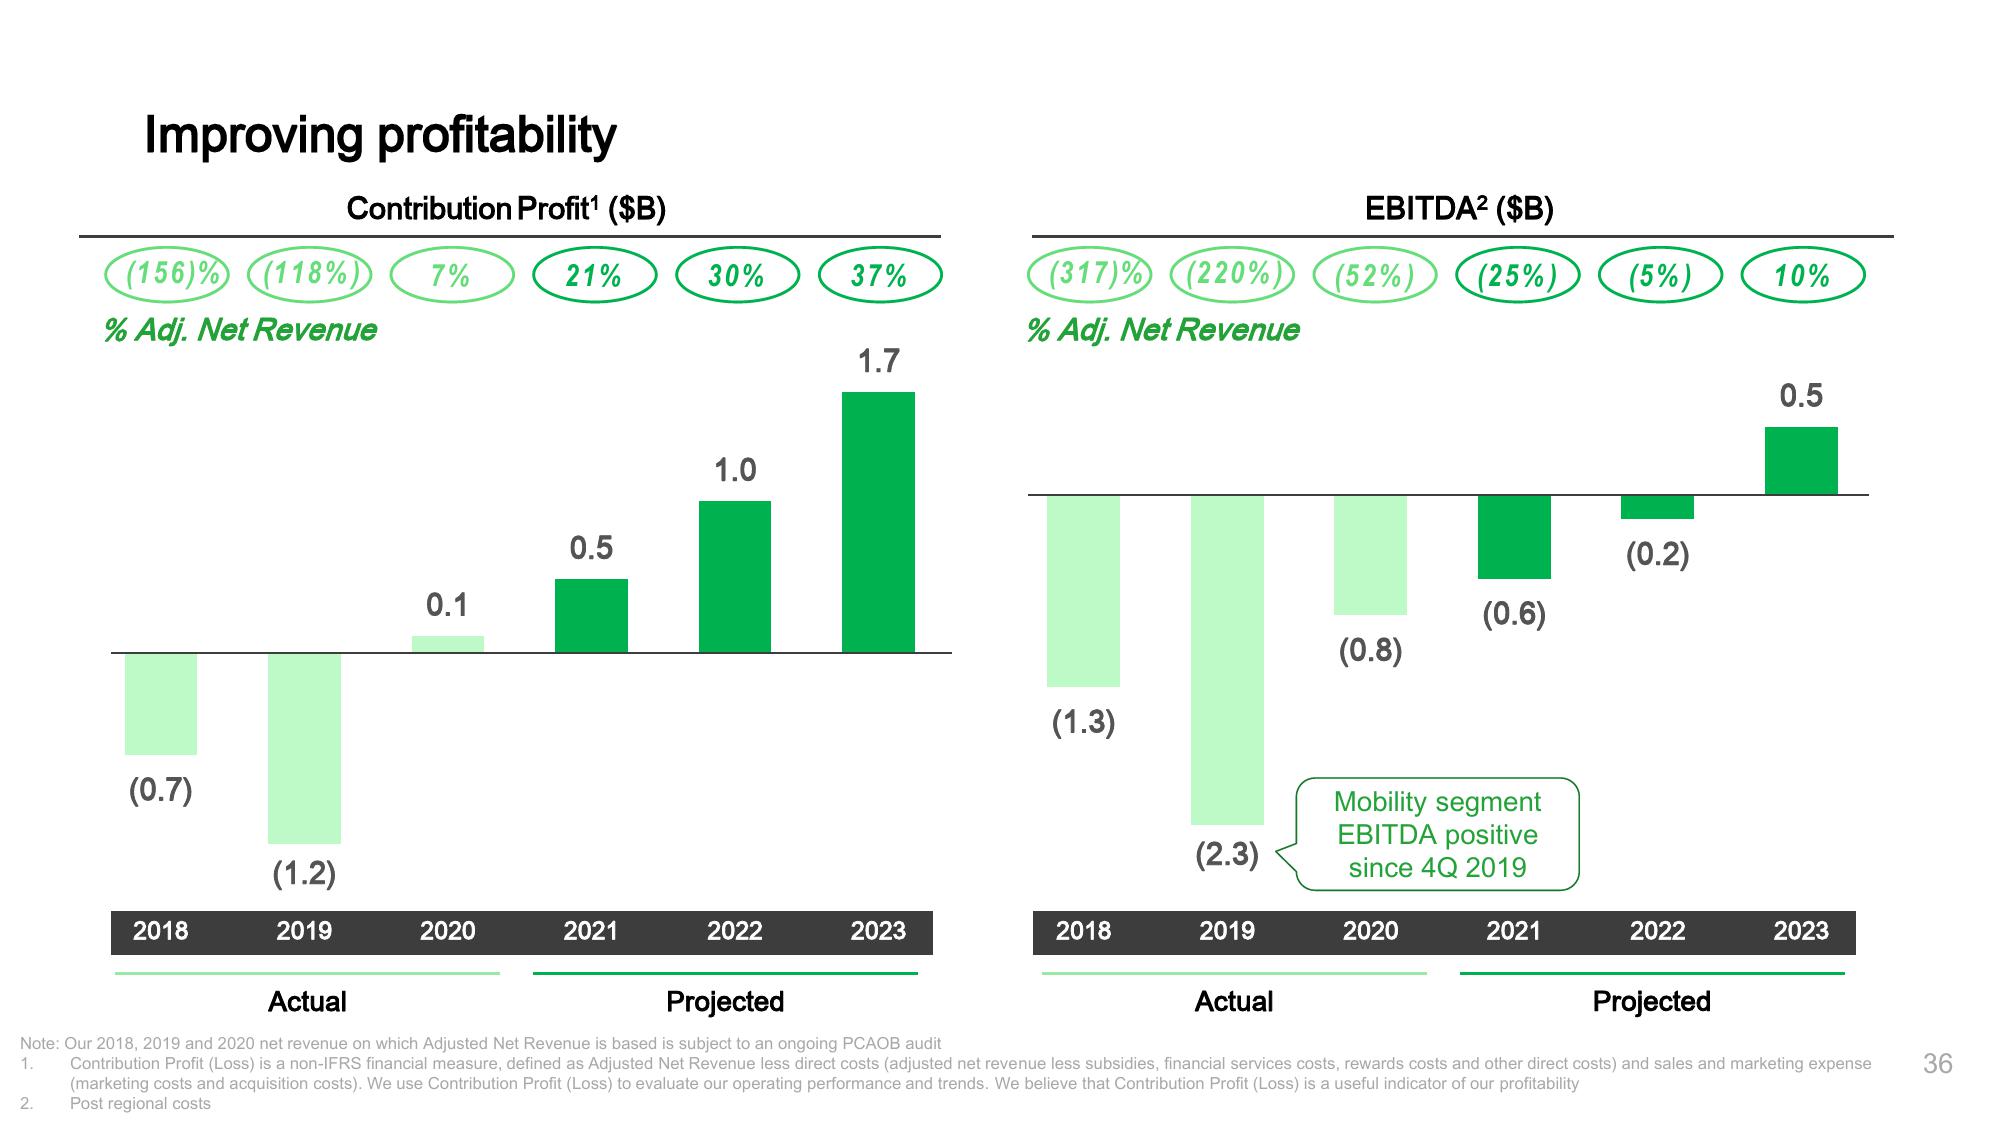
Improving profitability
2.
(156)% (118%) 7%
% Adj. Net Revenue
(0.7)
2018
Contribution Profit¹ ($B)
(1.2)
2019
0.1
2020
21%
0.5
2021
30%
1.0
2022
37%
1.7
2023
(317)% (220%)
% Adj. Net Revenue
(1.3)
2018
(2.3)
2019
EBITDA² ($B)
(52%) (25%) (5%) 10%
Actual
(0.8)
(0.6)
Mobility segment
EBITDA positive
since 4Q 2019
2020
2021
(0.2)
2022
0.5
Actual
Projected
Projected
1.
Note: Our 2018, 2019 and 2020 net revenue on which Adjusted Net Revenue is based is subject to an ongoing PCAOB audit
Contribution Profit (Loss) is a non-IFRS financial measure, defined as Adjusted Net Revenue less direct costs (adjusted net revenue less subsidies, financial services costs, rewards costs and other direct costs) and sales and marketing expense 36
(marketing costs and acquisition costs). We use Contribution Profit (Loss) to evaluate our operating performance and trends. We believe that Contribution Profit (Loss) is a useful indicator of our profitability
Post regional costs
2023View entire presentation