Inovalon Results Presentation Deck
Continued Growth Momentum
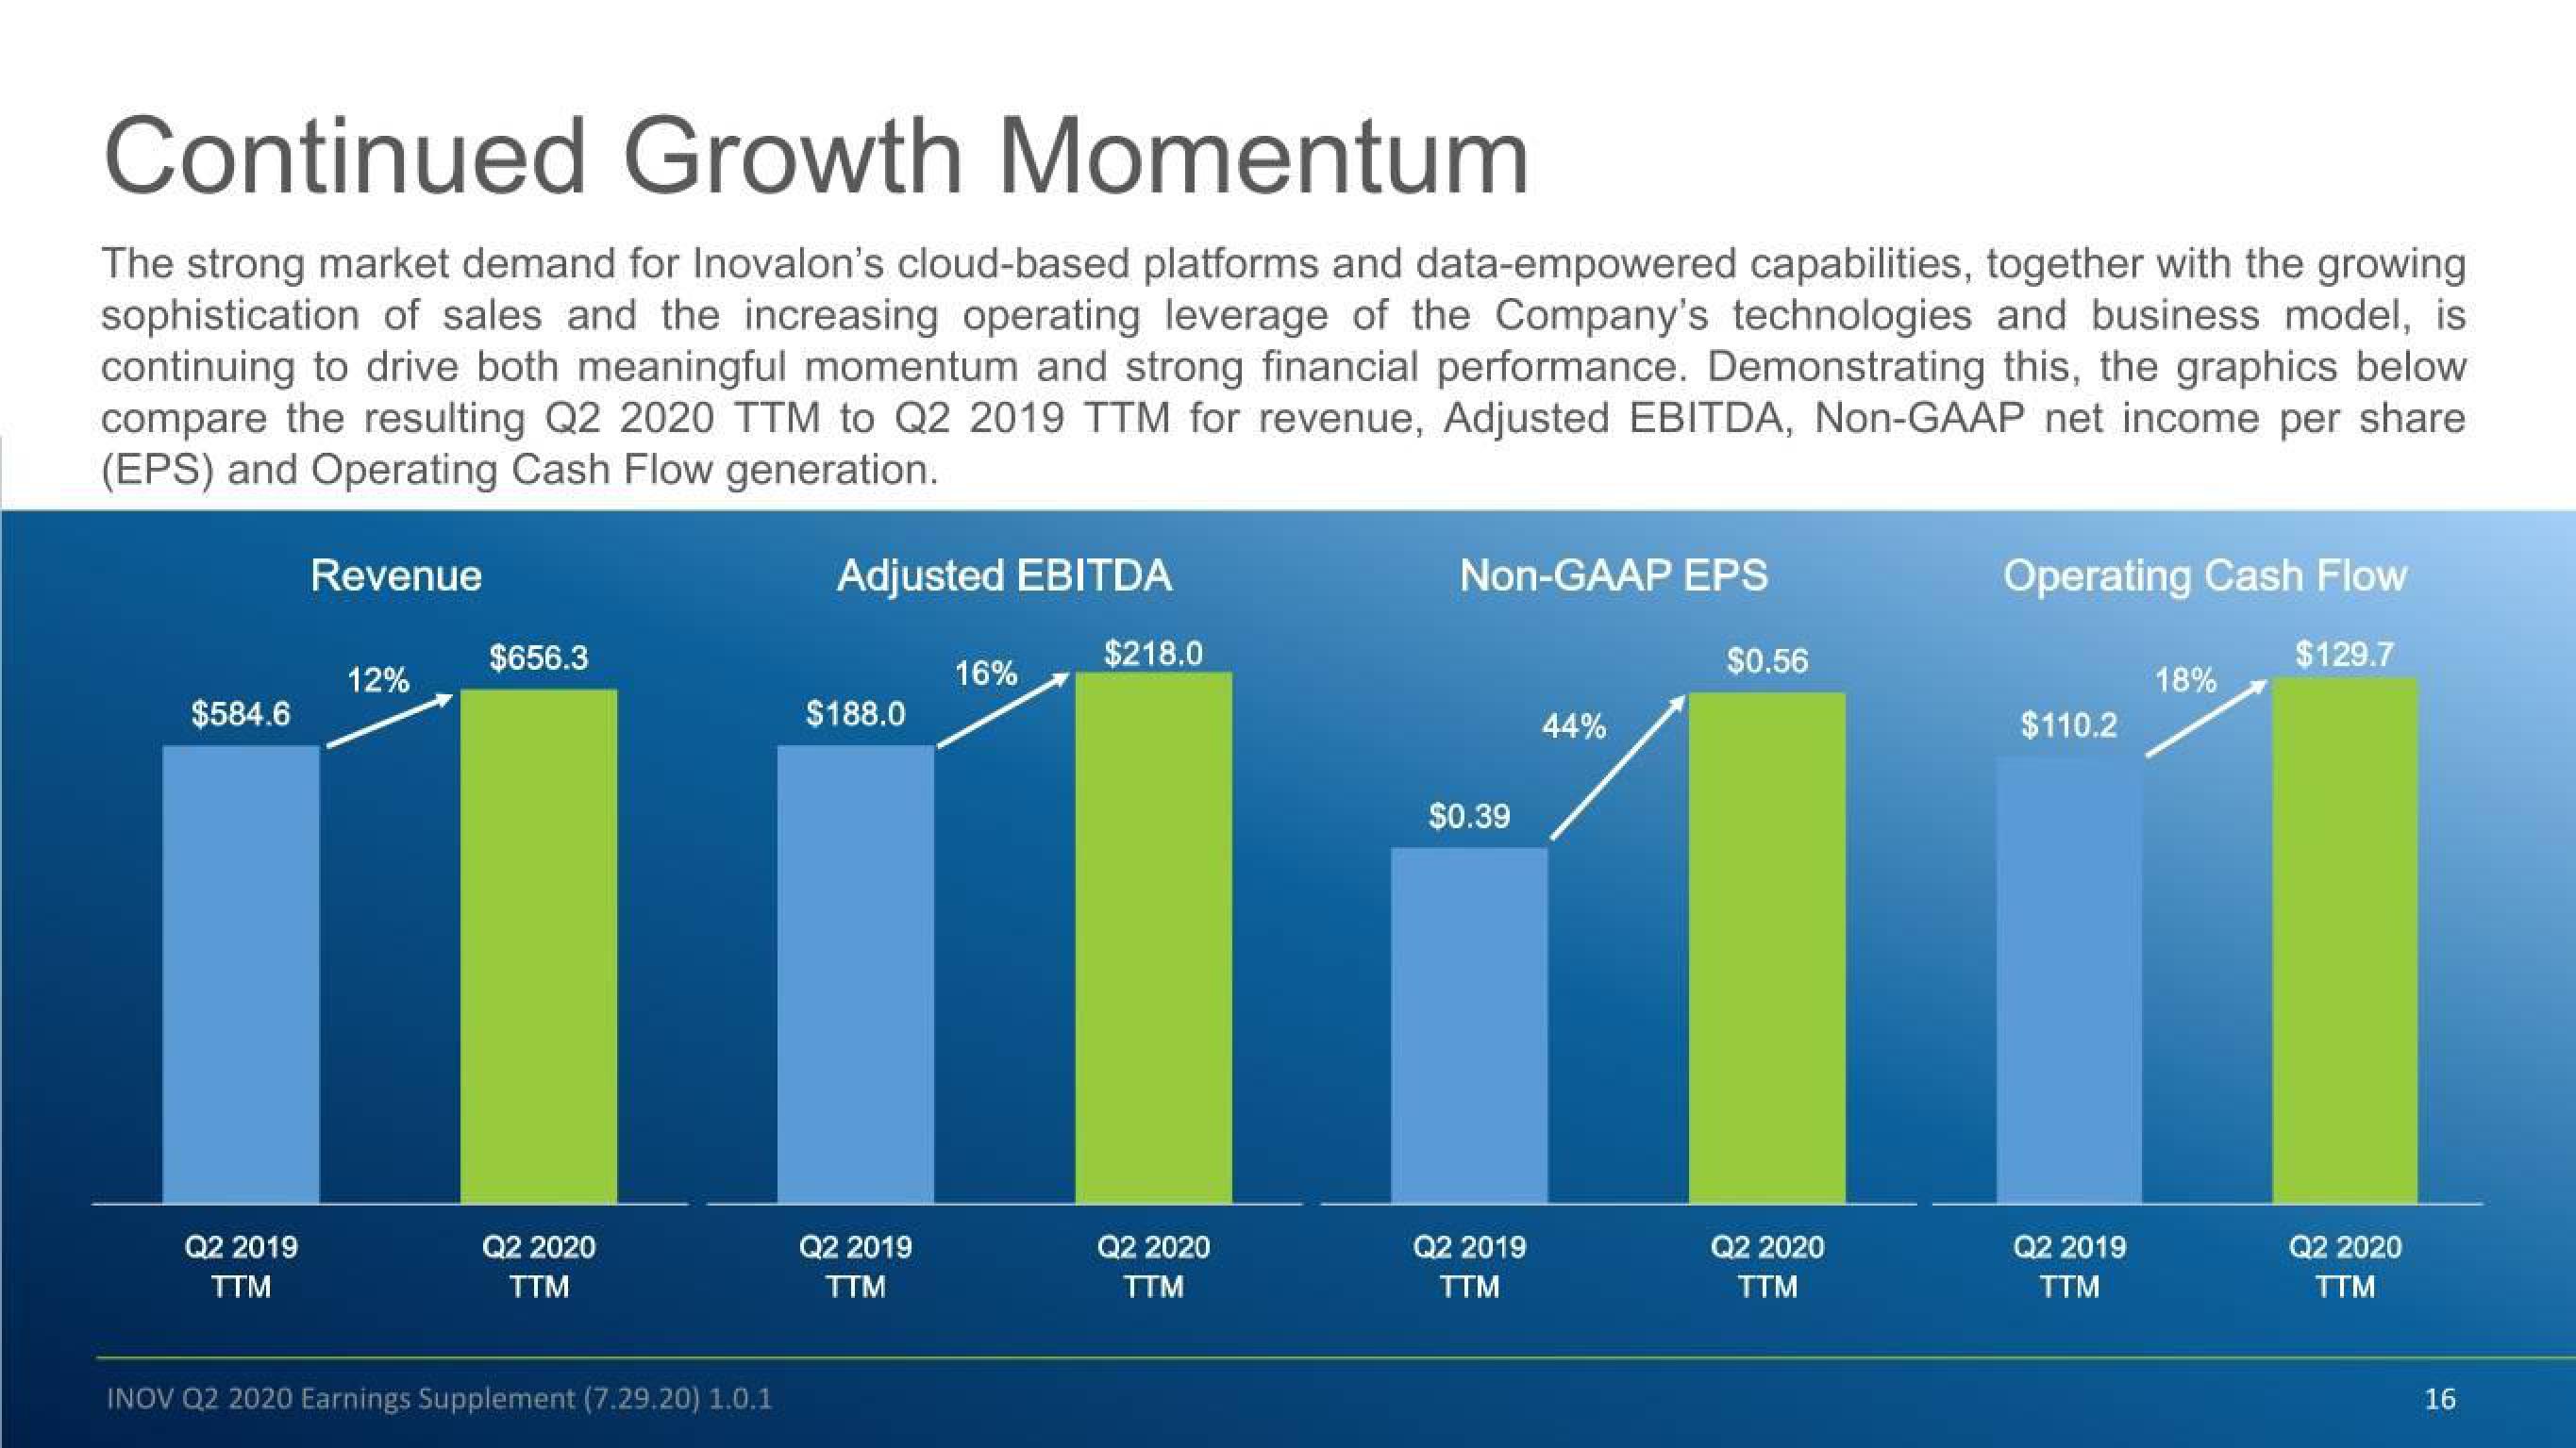
The strong market demand for Inovalon's cloud-based platforms and data-empowered capabilities, together with the growing
sophistication of sales and the increasing operating leverage of the Company's technologies and business model, is
continuing to drive both meaningful momentum and strong financial performance. Demonstrating this, the graphics below
compare the resulting Q2 2020 TTM to Q2 2019 TTM for revenue, Adjusted EBITDA, Non-GAAP net income per share
(EPS) and Operating Cash Flow generation.
$584.6
Q2 2019
TTM
Revenue
12%
$656.3
Q2 2020
TTM
INOV Q2 2020 Earnings Supplement (7.29.20) 1.0.1
Adjusted EBITDA
$188.0
Q2 2019
TTM
16%
$218.0
Q2 2020
TTM
Non-GAAP EPS
$0.39
Q2 2019
TTM
44%
Operating Cash Flow
$129.7
$0.56
$110.2
11
Q2 2020
TTM
Q2 2019
TTM
18%
Q2 2020
TTM
16View entire presentation