Tesla Results Presentation Deck
HIGHLIGHTS
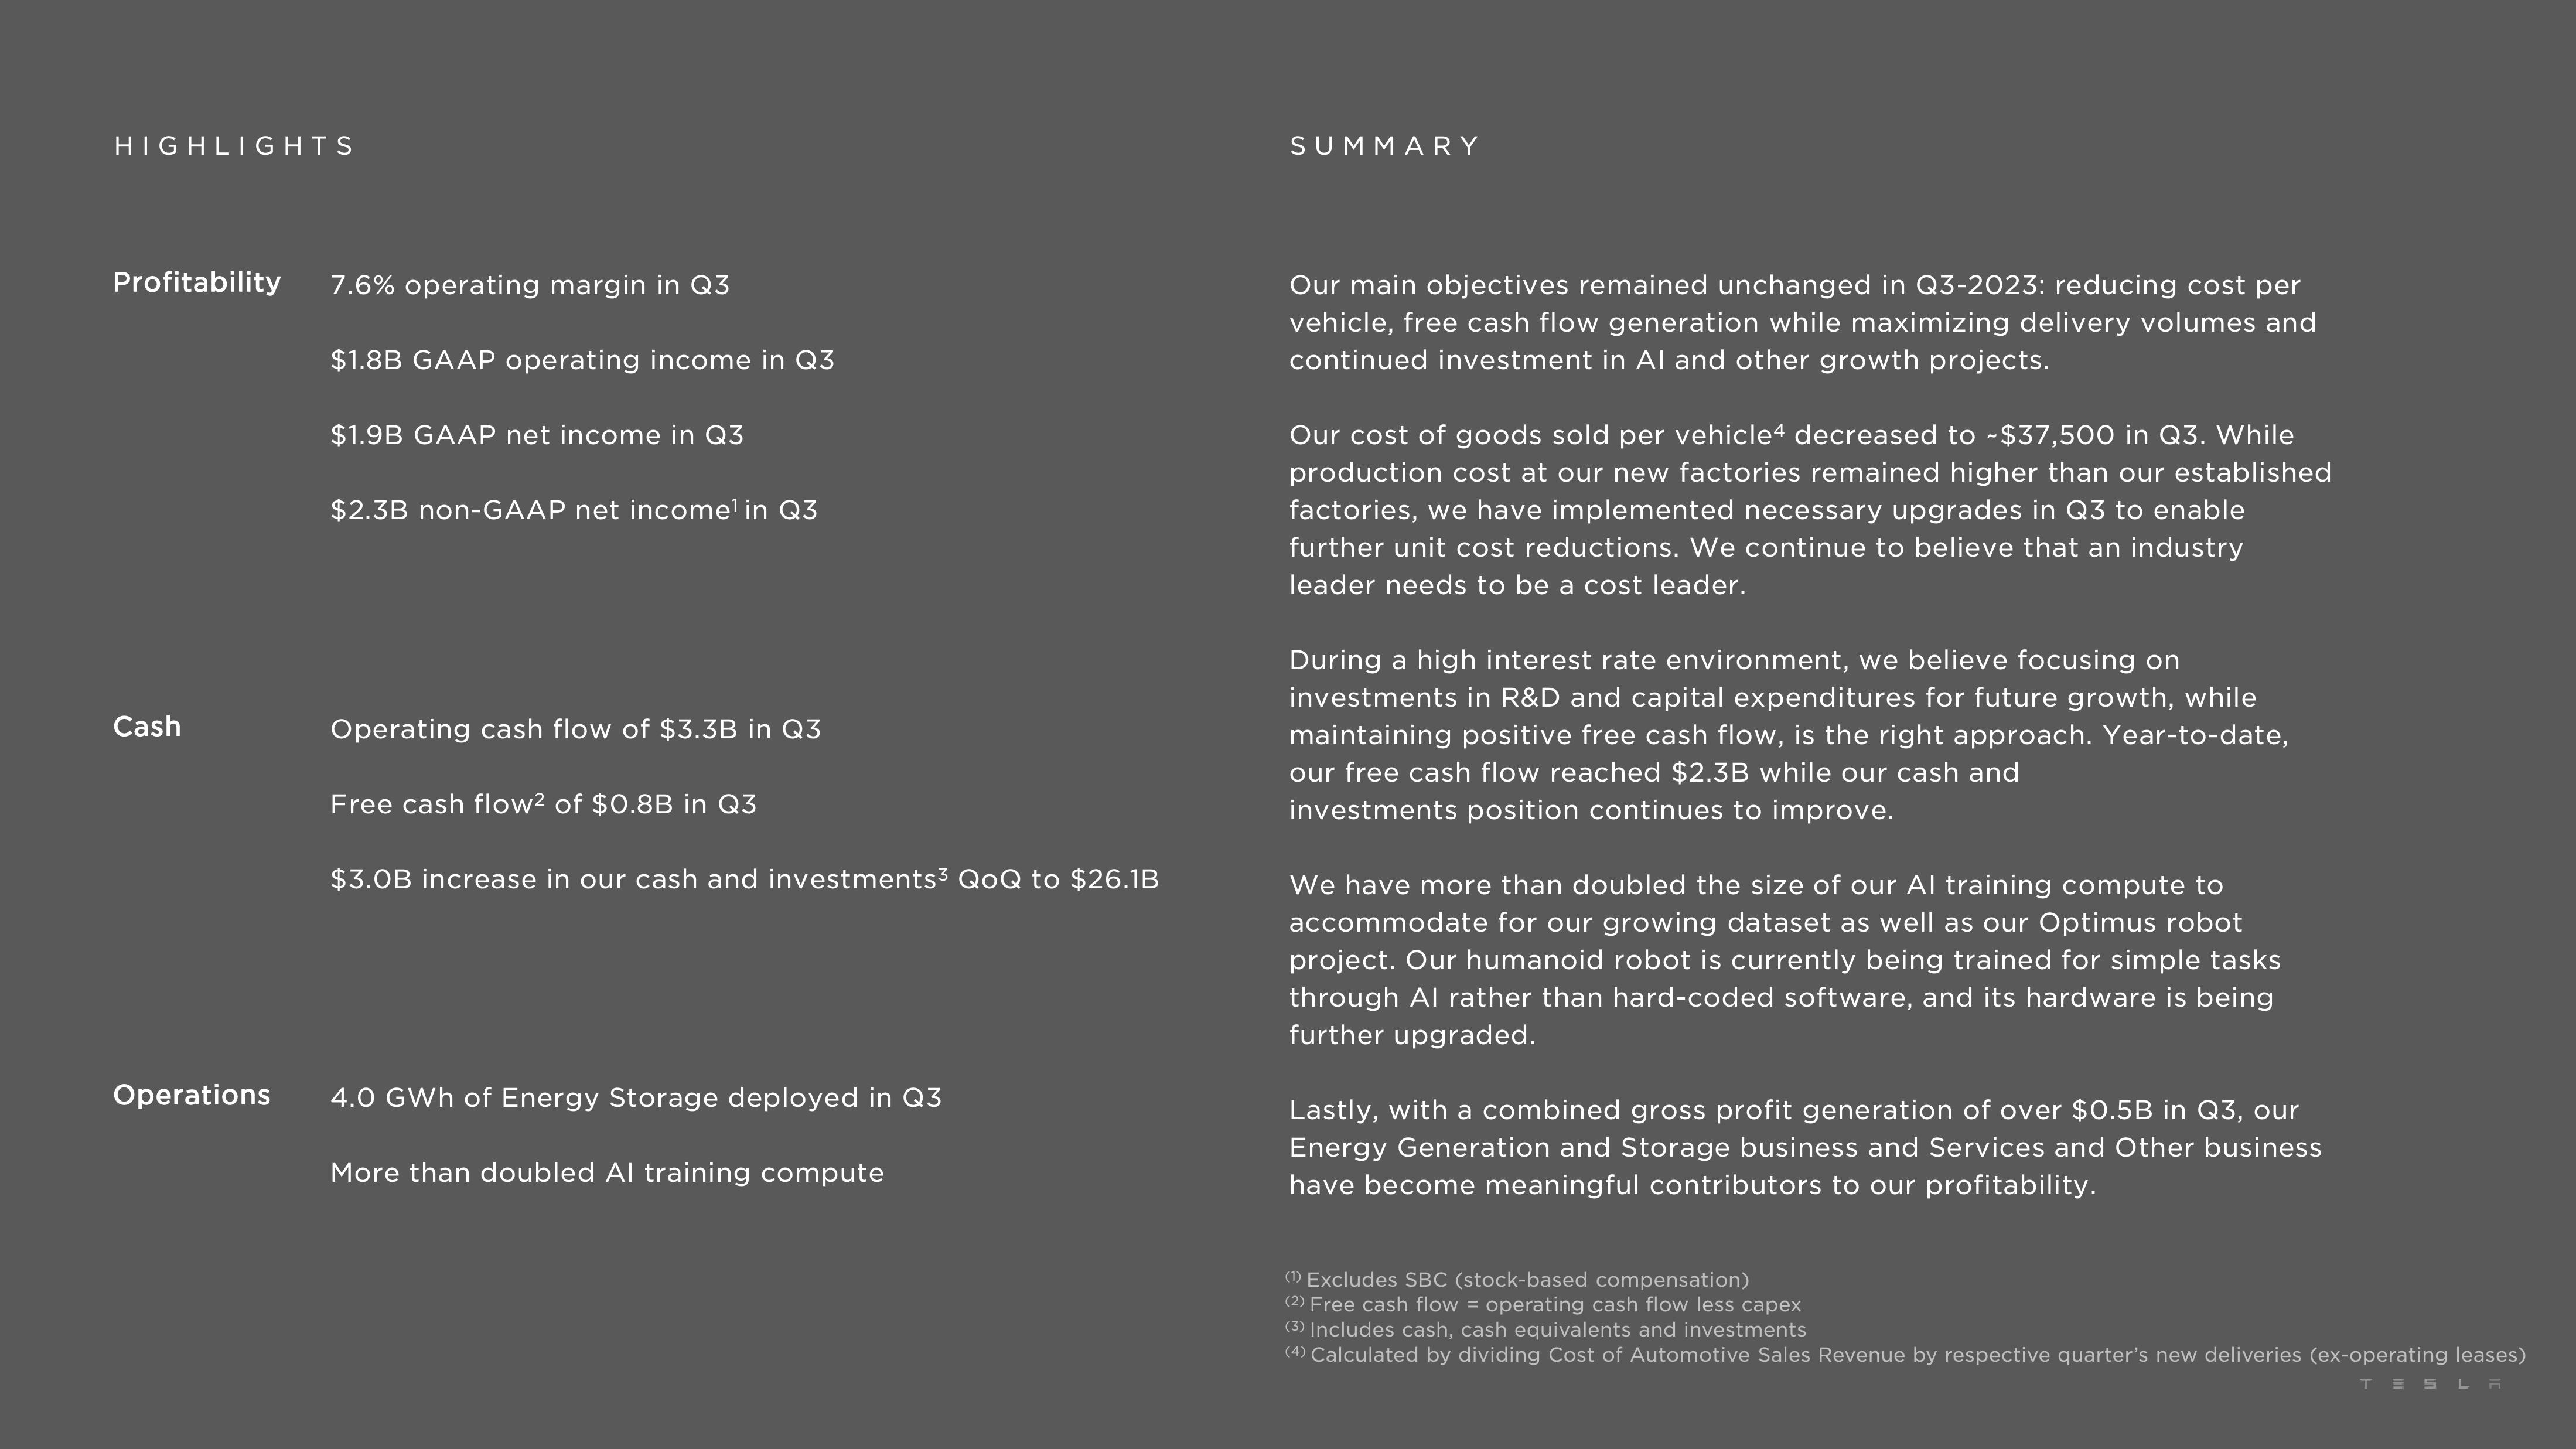
Profitability 7.6% operating margin in Q3
Cash
Operations
$1.8B GAAP operating income in Q3
$1.9B GAAP net income in Q3
$2.3B non-GAAP net income¹ in Q3
Operating cash flow of $3.3B in Q3
Free cash flow² of $0.8B in Q3
$3.0B increase in our cash and investments3 QoQ to $26.1B
4.0 GWh of Energy Storage deployed in Q3
More than doubled Al training compute
SUMMARY
Our main objectives remained unchanged in Q3-2023: reducing cost per
vehicle, free cash flow generation while maximizing delivery volumes and
continued investment in Al and other growth projects.
Our cost of goods sold per vehicle4 decreased to -$37,500 in Q3. While
production cost at our new factories remained higher than our established
factories, we have implemented necessary upgrades in Q3 to enable
further unit cost reductions. We continue to believe that an industry
leader needs to be a cost leader.
During a high interest rate environment, we believe focusing on
investments in R&D and capital expenditures for future growth, while
maintaining positive free cash flow, is the right approach. Year-to-date,
our free cash flow reached $2.3B while our cash and
investments position continues to improve.
We have more than doubled the size of our Al training compute to
accommodate for our growing dataset as well as our Optimus robot
project. Our humanoid robot is currently being trained for simple tasks
through Al rather than hard-coded software, and its hardware is being
further upgraded.
Lastly, with a combined gross profit generation of over $0.5B in Q3, our
Energy Generation and Storage business and Services and Other business
have become meaningful contributors to our profitability.
(1) Excludes SBC (stock-based compensation)
(2) Free cash flow = operating cash flow less capex
(3) Includes cash, cash equivalents and investments
(4) Calculated by dividing Cost of Automotive Sales Revenue by respective quarter's new deliveries (ex-operating leases)
TESLAView entire presentation