BlackRock Global Long/Short Credit Absolute Return Credit
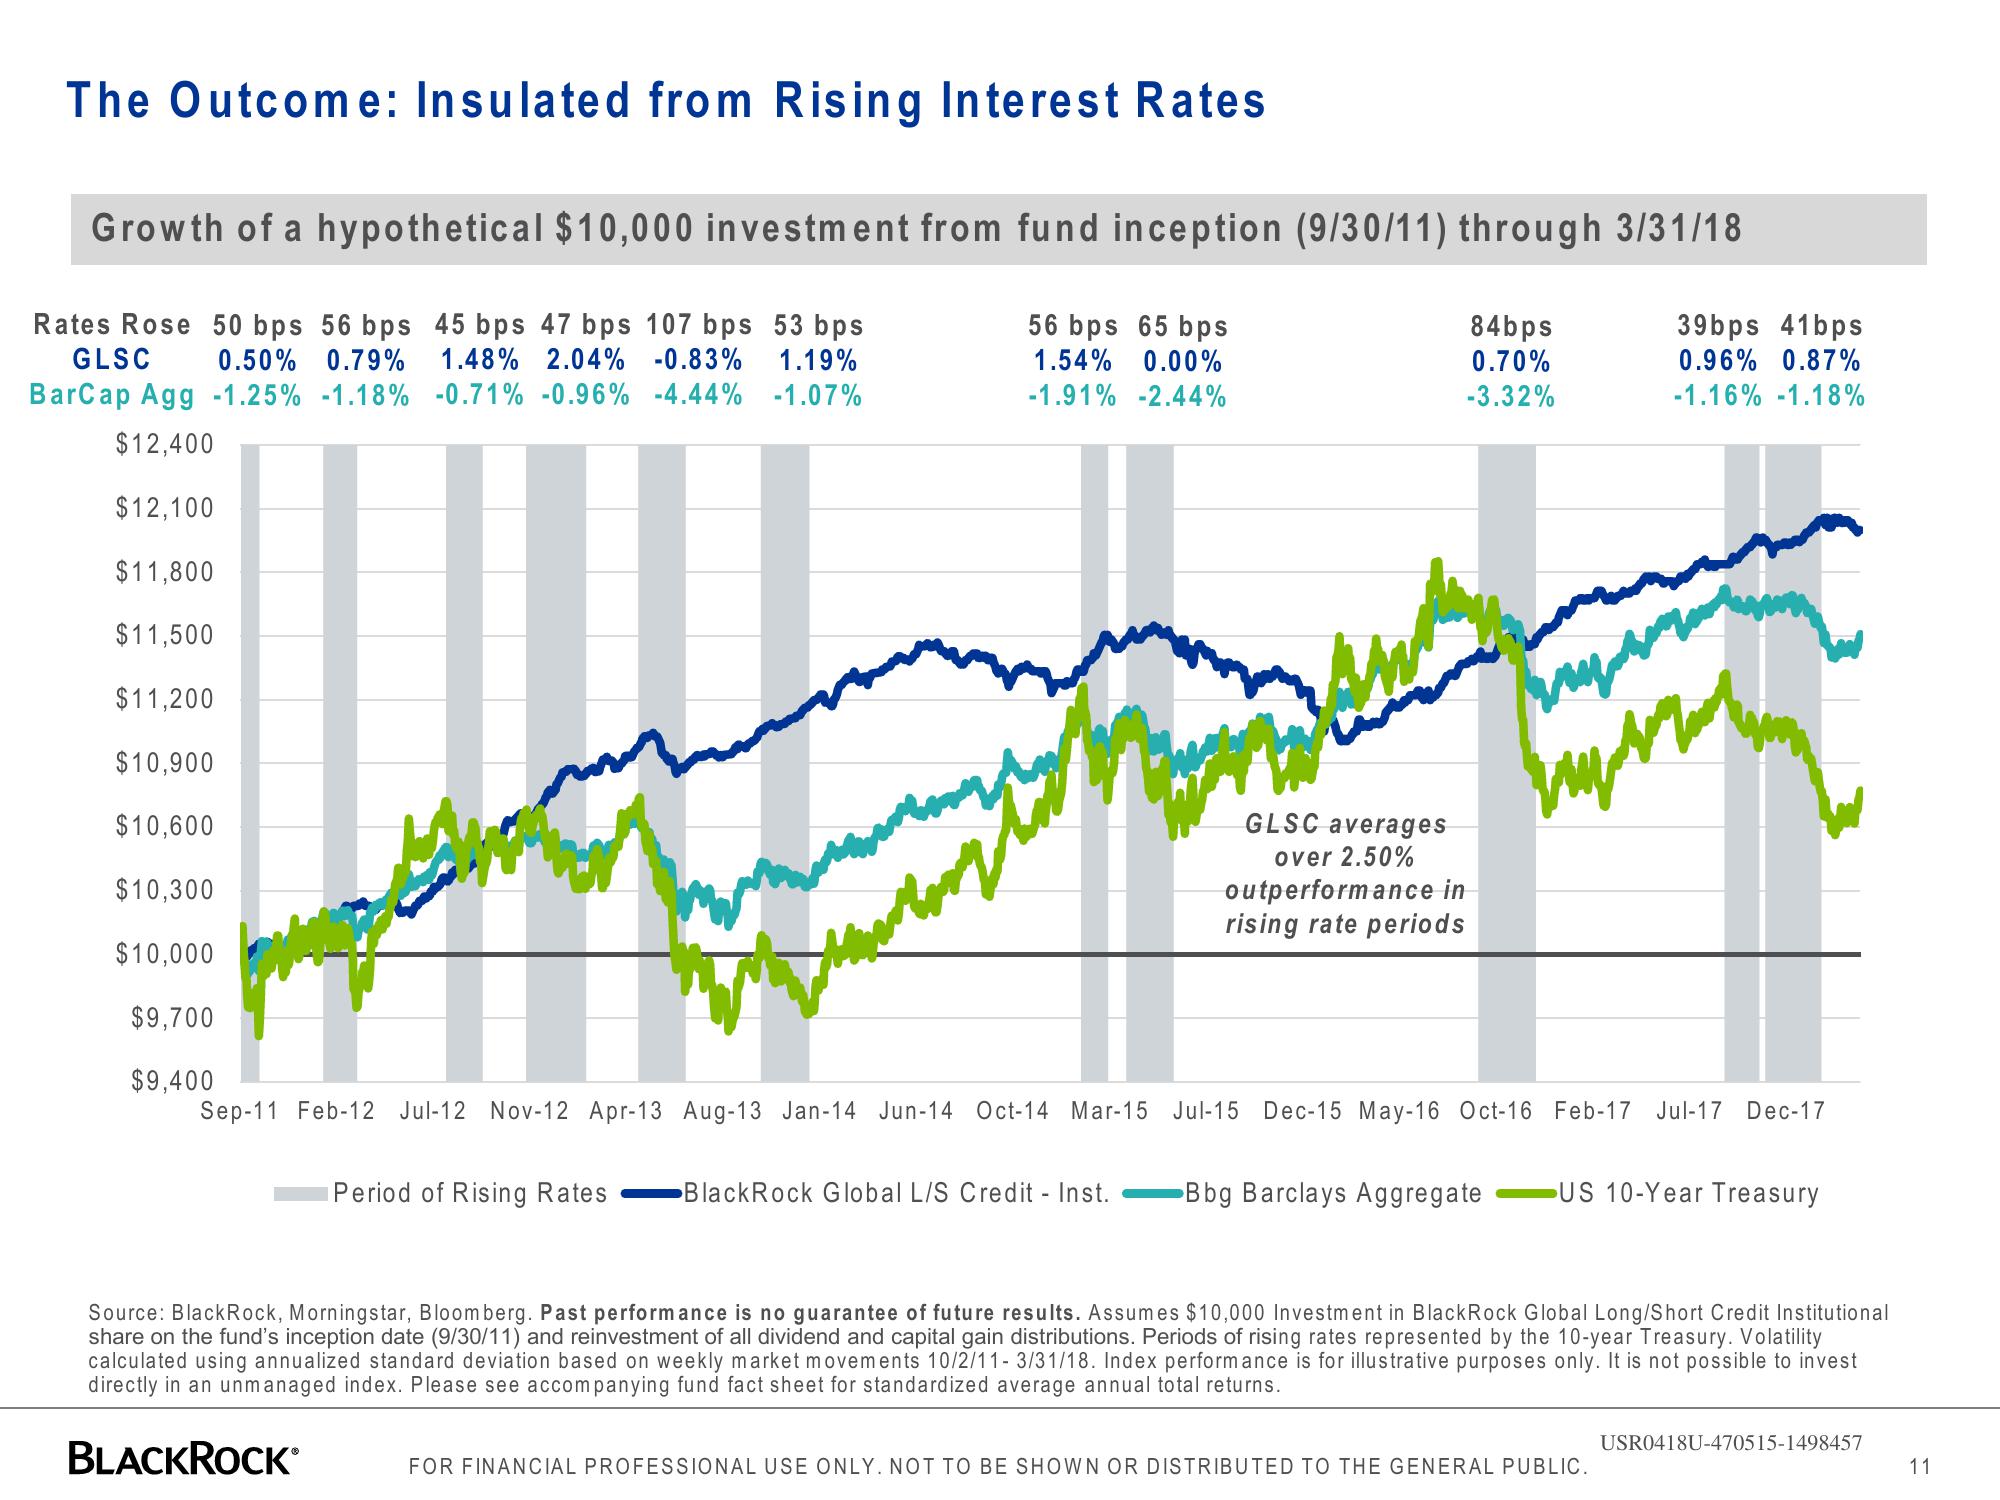
The Outcome: Insulated from Rising Interest Rates.
Growth of a hypothetical $10,000 investment from fund inception (9/30/11) through 3/31/18
Rates Rose 50 bps 56 bps 45 bps 47 bps 107 bps 53 bps
GLSC 0.50% 0.79% 1.48% 2.04% -0.83% 1.19%
BarCap Agg -1.25% -1.18% -0.71% -0.96% -4.44% -1.07%
56 bps 65 bps
1.54% 0.00%
-1.91% -2.44%
$12,400
$12,100
$11,800
$11,500
$11,200
$10,900
$10,600
$10,300
$10,000
$9,700
$9,400
Herber
Period of Rising Rates
GLSC averages
over 2.50%
BlackRock Global L/S Credit - Inst.
84bps
0.70%
-3.32%
outperformance in
rising rate periods
www.
Sep-11 Feb-12 Jul-12 Nov-12 Apr-13 Aug-13 Jan-14 Jun-14 Oct-14 Mar-15 Jul-15 Dec-15 May-16 Oct-16 Feb-17 Jul-17 Dec-17
Bbg Barclays Aggregate
www
39bps 41bps
0.96% 0.87%
-1.16% -1.18%
US 10-Year Treasury
Source: BlackRock, Morningstar, Bloomberg. Past performance is no guarantee of future results. Assumes $10,000 Investment in BlackRock Global Long/Short Credit Institutional
share on the fund's inception date (9/30/11) and reinvestment of all dividend and capital gain distributions. Periods of rising rates represented by the 10-year Treasury. Volatility
calculated using annualized standard deviation based on weekly market movements 10/2/11-3/31/18. Index performance is for illustrative purposes only. It is not possible to invest
directly in an unmanaged index. Please see accompanying fund fact sheet for standardized average annual total returns.
BLACKROCK*
FOR FINANCIAL PROFESSIONAL USE ONLY. NOT TO BE SHOWN OR DISTRIBUTED TO THE GENERAL PUBLIC.
USR0418U-470515-1498457
11View entire presentation