Ashtead Group Results Presentation Deck
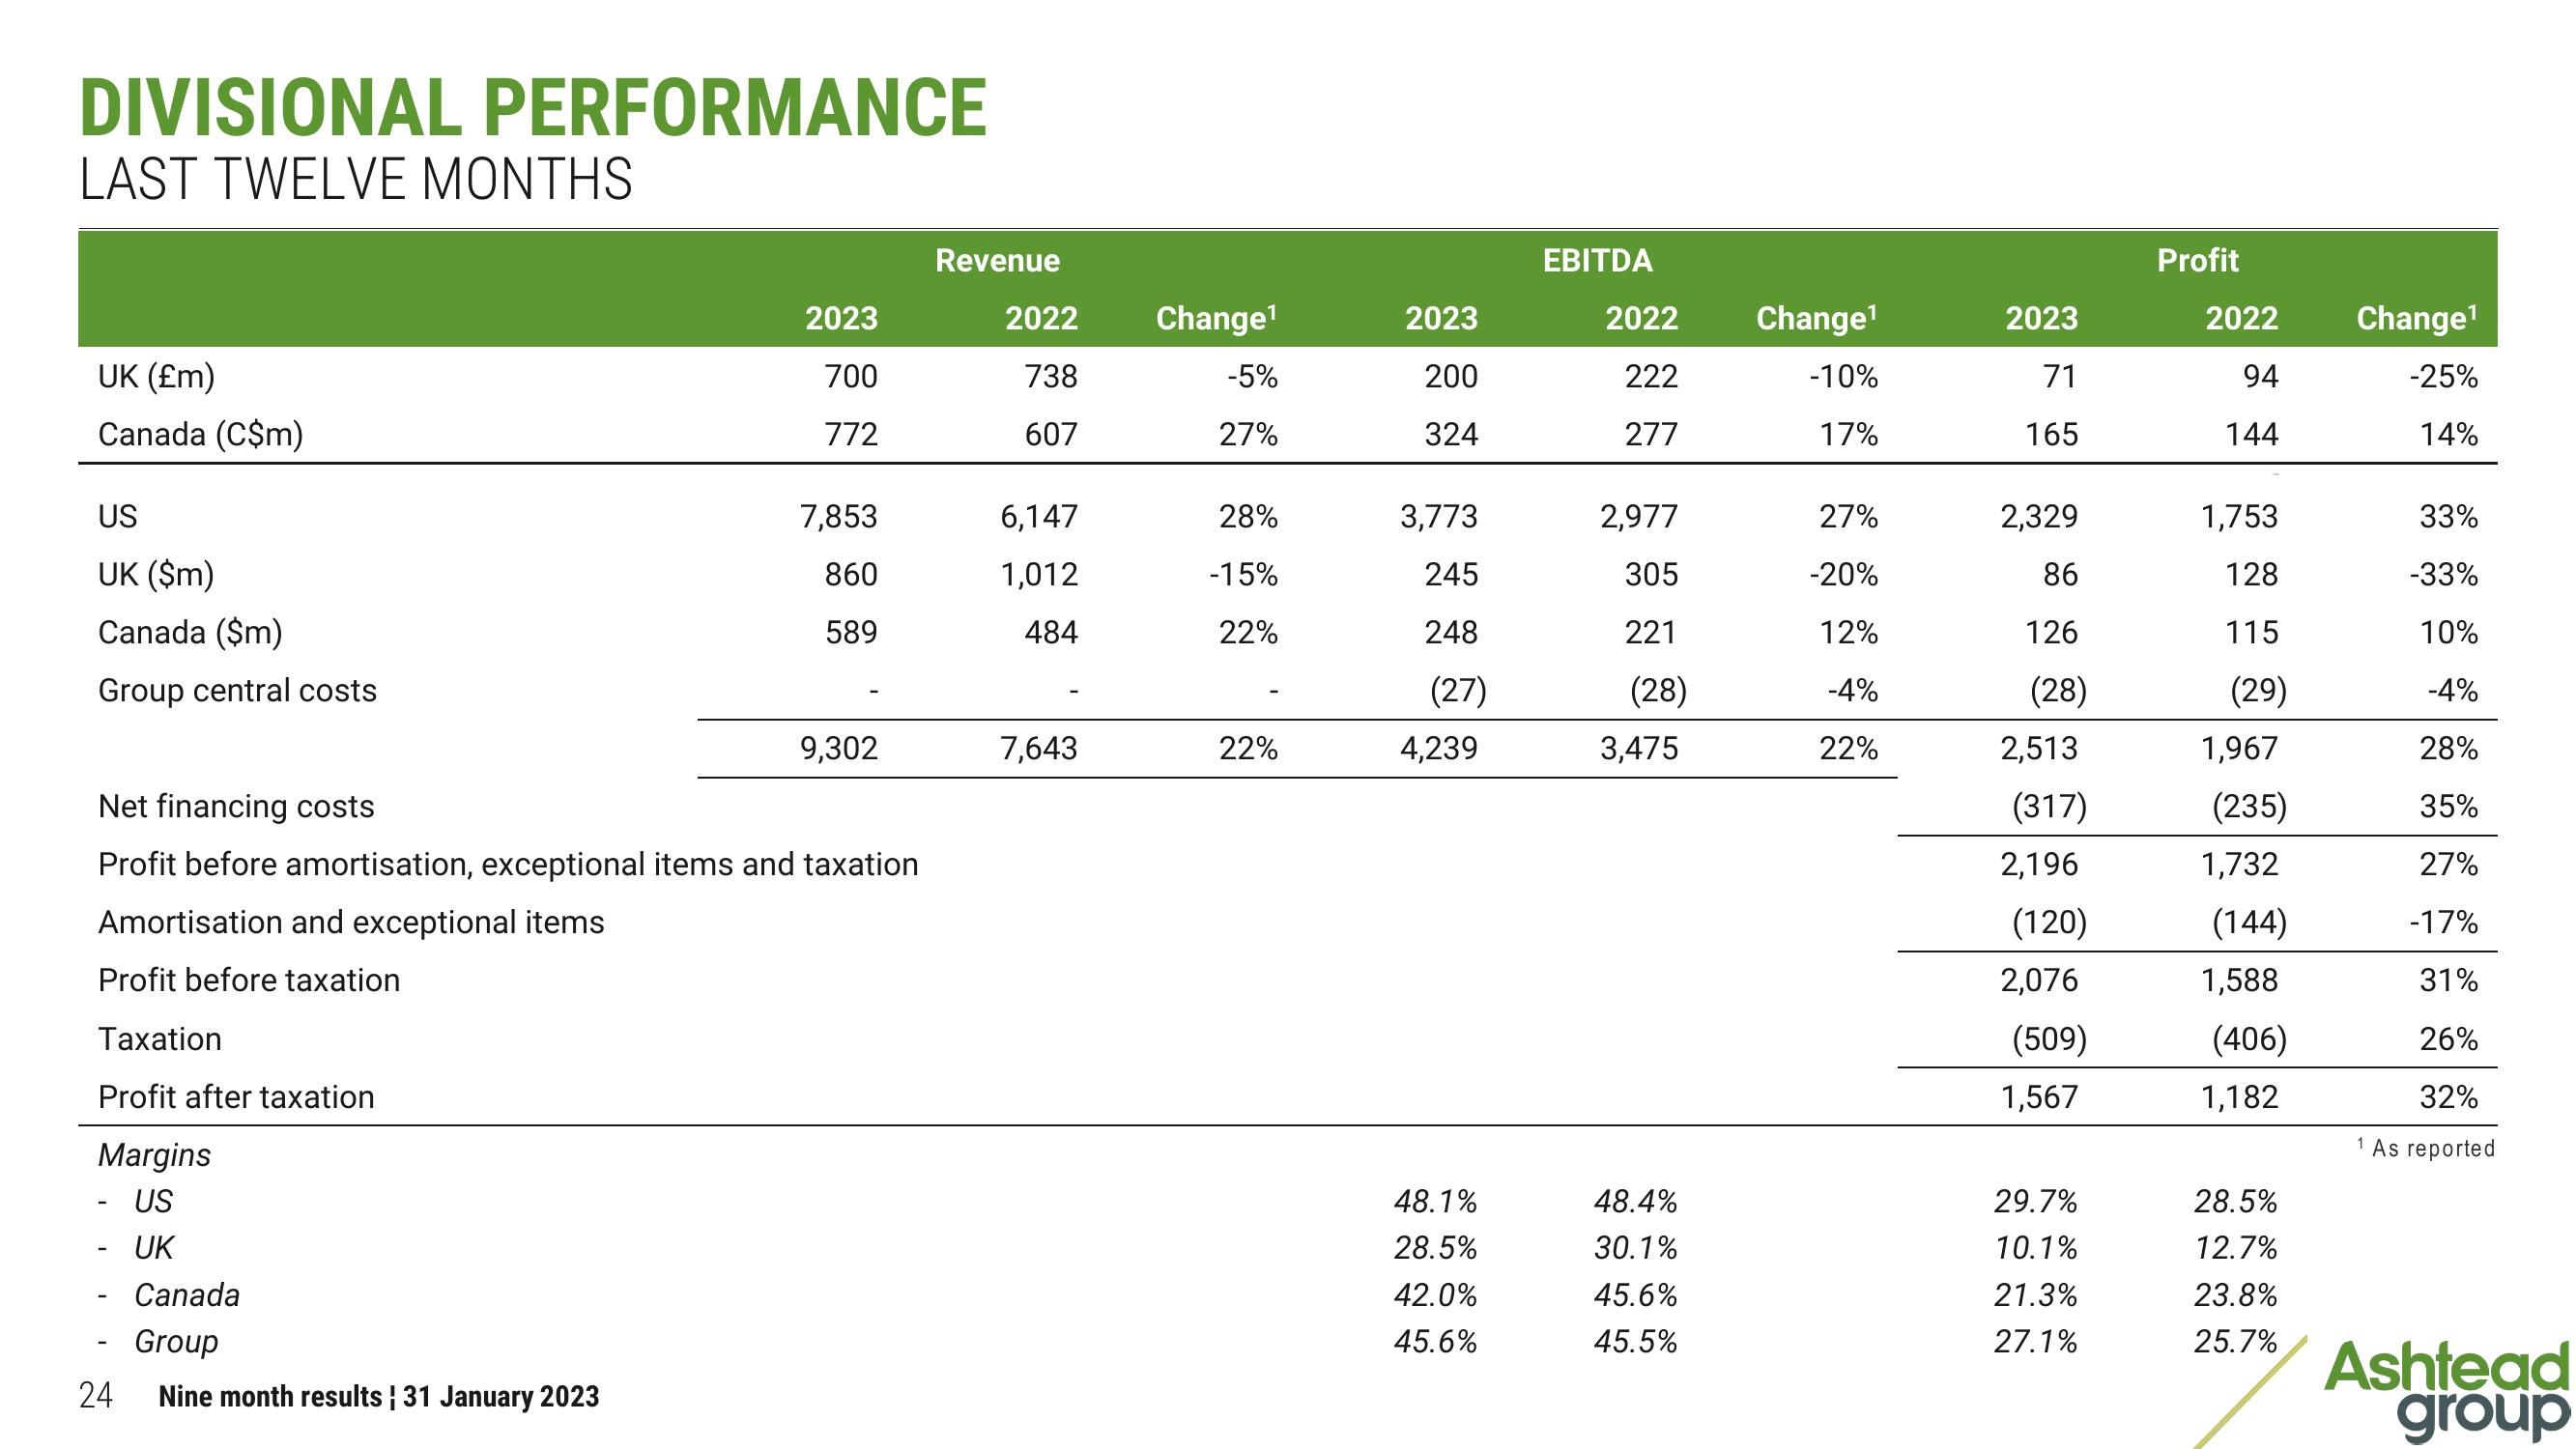
DIVISIONAL PERFORMANCE
LAST TWELVE MONTHS
UK (£m)
Canada (C$m)
US
UK ($m)
Canada ($m)
Group central costs
24
2023
700
772
Canada
Group
Nine month results | 31 January 2023
7,853
860
589
Net financing costs
Profit before amortisation, exceptional items and taxation
Amortisation and exceptional items
Profit before taxation
Taxation
Profit after taxation
Margins
- US
UK
9,302
Revenue
2022
738
607
6,147
1,012
484
7,643
Change¹
-5%
27%
28%
-15%
22%
22%
2023
200
324
3,773
245
248
(27)
4,239
48.1%
28.5%
42.0%
45.6%
EBITDA
2022
222
277
2,977
305
221
(28)
3,475
48.4%
30.1%
45.6%
45.5%
Change¹
-10%
17%
27%
-20%
12%
-4%
22%
2023
71
165
2,329
86
126
(28)
2,513
(317)
2,196
(120)
2,076
(509)
1,567
29.7%
10.1%
21.3%
27.1%
Profit
2022
94
144
1,753
128
115
(29)
1,967
(235)
1,732
(144)
1,588
(406)
1,182
28.5%
12.7%
23.8%
25.7%
Change¹
-25%
14%
1
33%
-33%
10%
-4%
28%
35%
27%
-17%
31%
26%
32%
As reported
Ashtead
groupView entire presentation