Kinnevik Results Presentation Deck
Intro
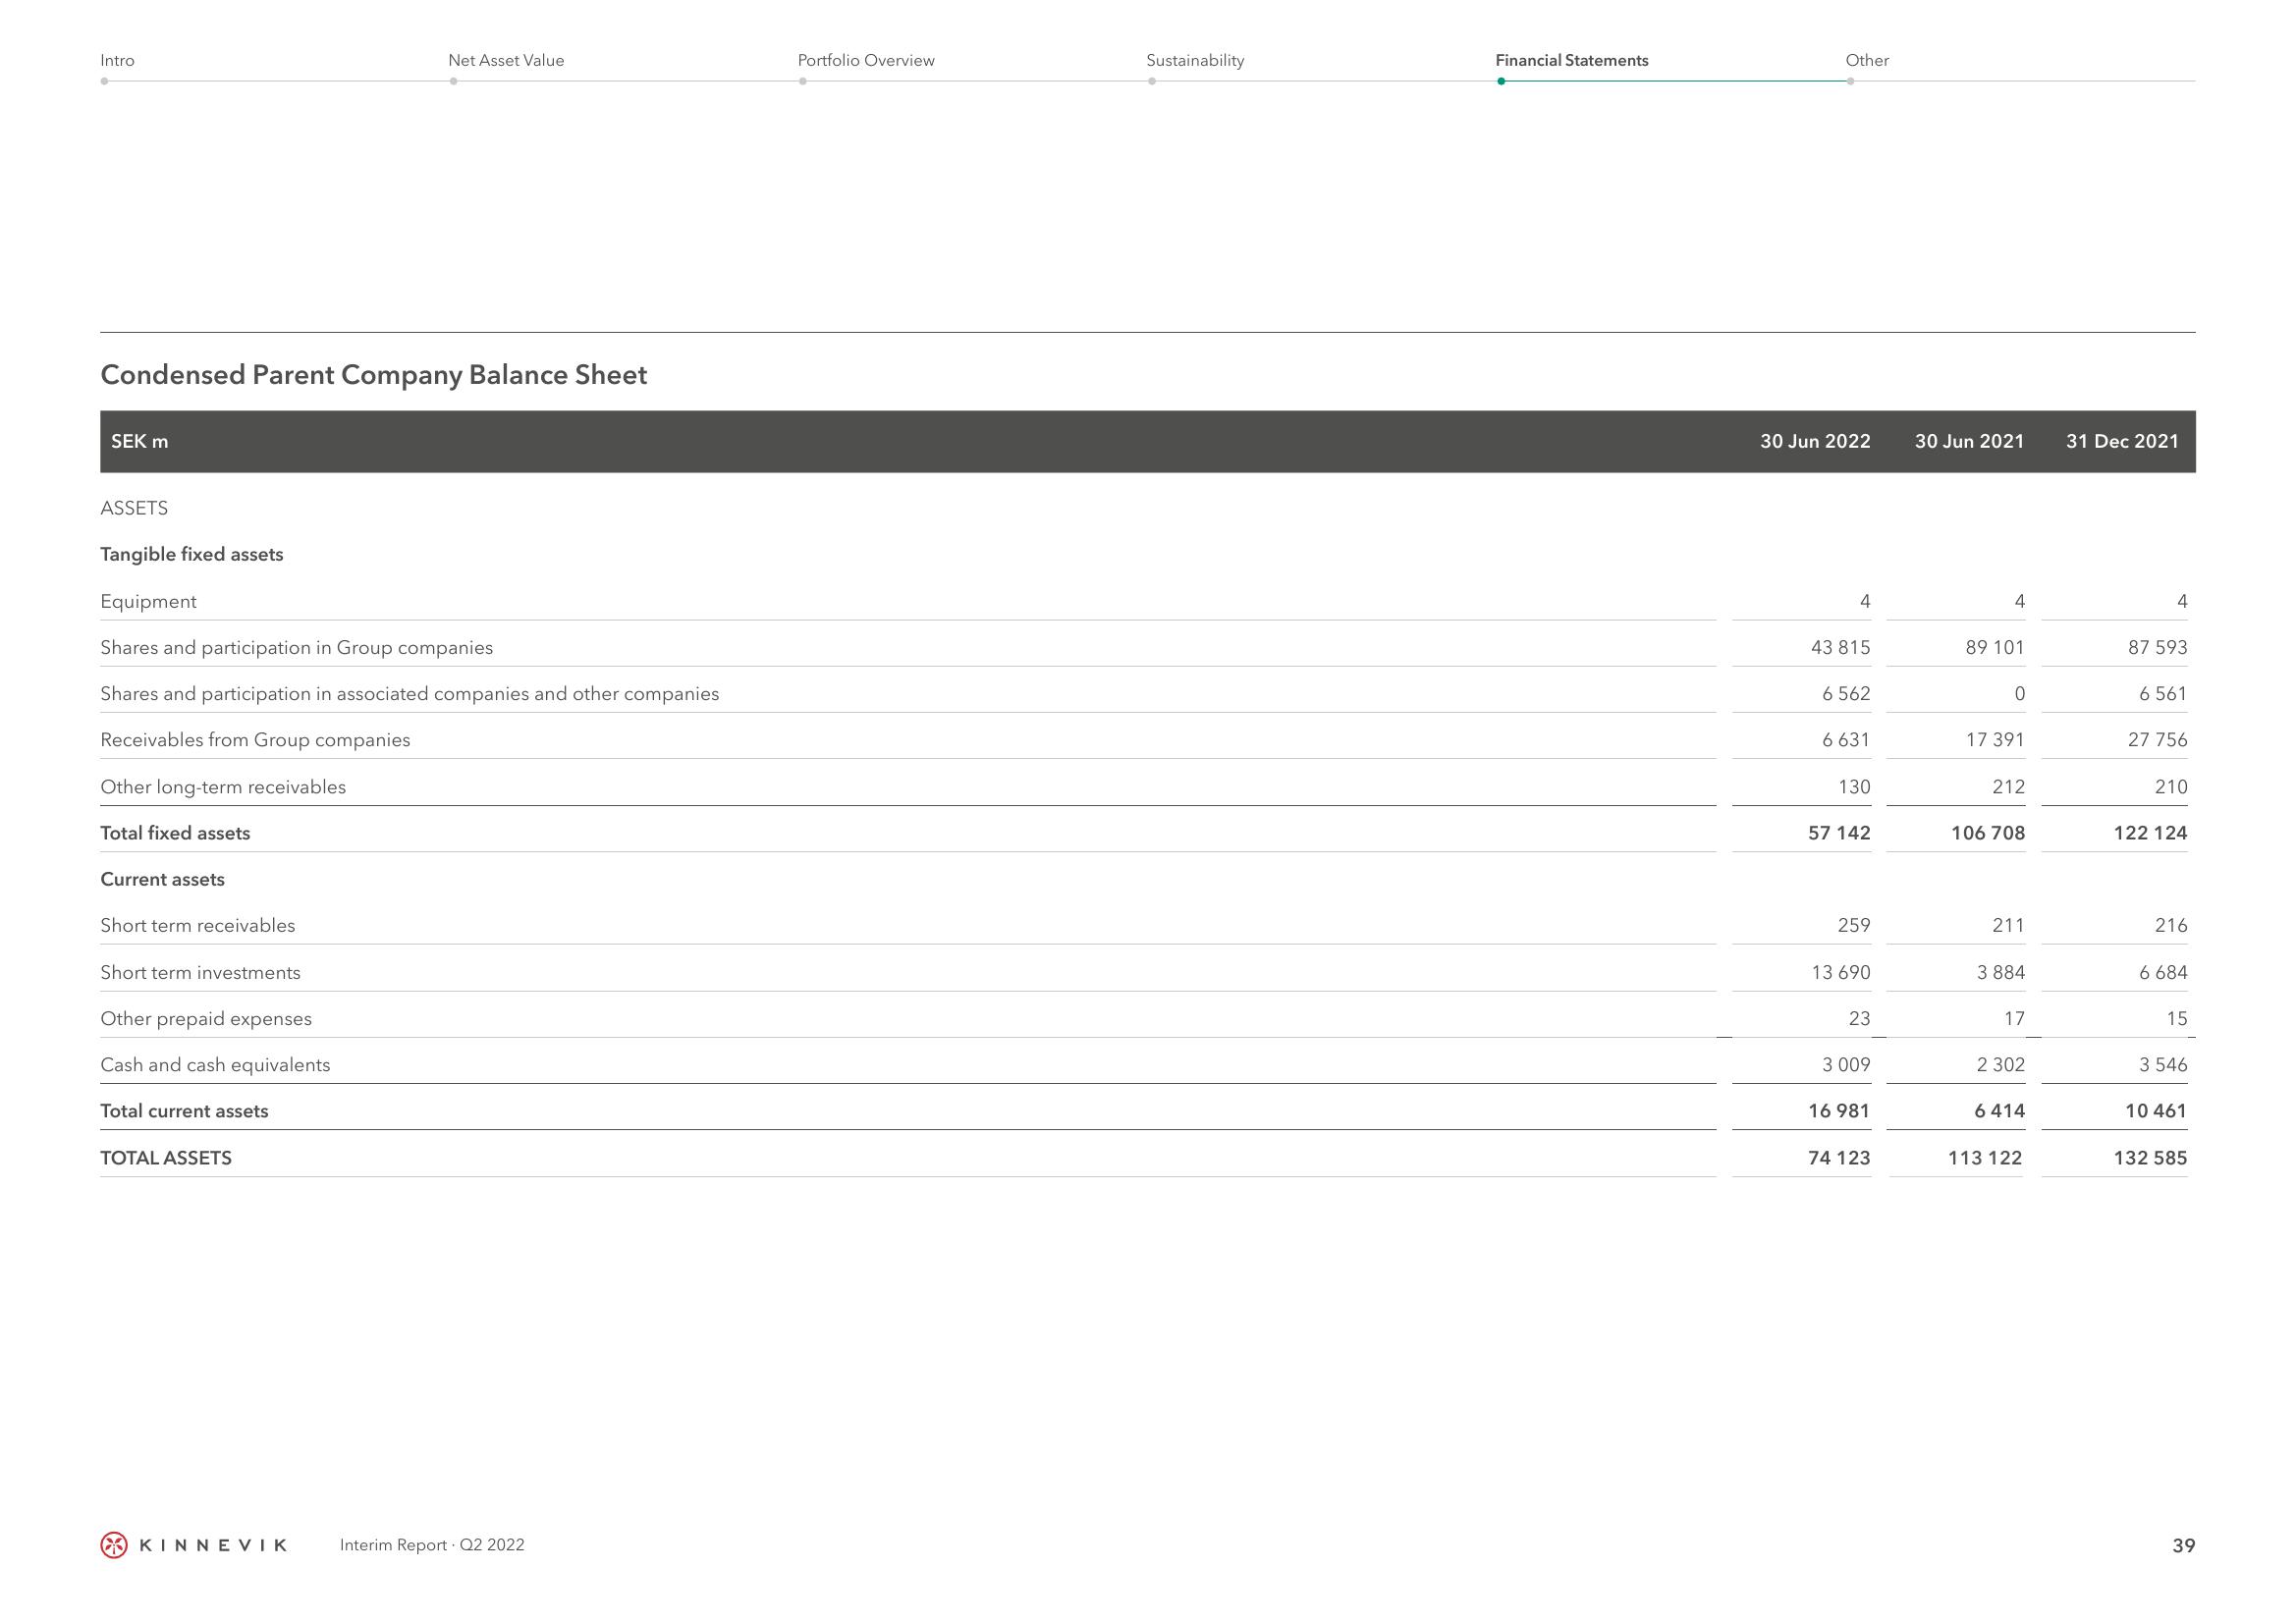
Condensed Parent Company Balance Sheet
SEK m
ASSETS
Tangible fixed assets
Equipment
Shares and participation in Group companies
Shares and participation in associated companies and other companies
Receivables from Group companies
Other long-term receivables
Total fixed assets
Current assets
Short term receivables
Short term investments
Other prepaid expenses
Cash and cash equivalents
Total current assets
Net Asset Value
TOTAL ASSETS
KINNEVIK
Interim Report. Q2 2022
Portfolio Overview
Sustainability
Financial Statements
Other
30 Jun 2022
4
43 815
6 562
6 631
130
57 142
259
13 690
23
3 009
16 981
74 123
30 Jun 2021
4
89 101
0
17 391
212
106 708
211
3 884
17
2 302
6414
113 122
31 Dec 2021
4
87 593
6 561
27 756
210
122 124
216
6 684
15
3 546
10 461
132 585
39View entire presentation