Bed Bath & Beyond Results Presentation Deck
Q3 PERFORMANCE HIGHLIGHTS & TRANSFORMATION UPDATE
Q3 key performance metrics
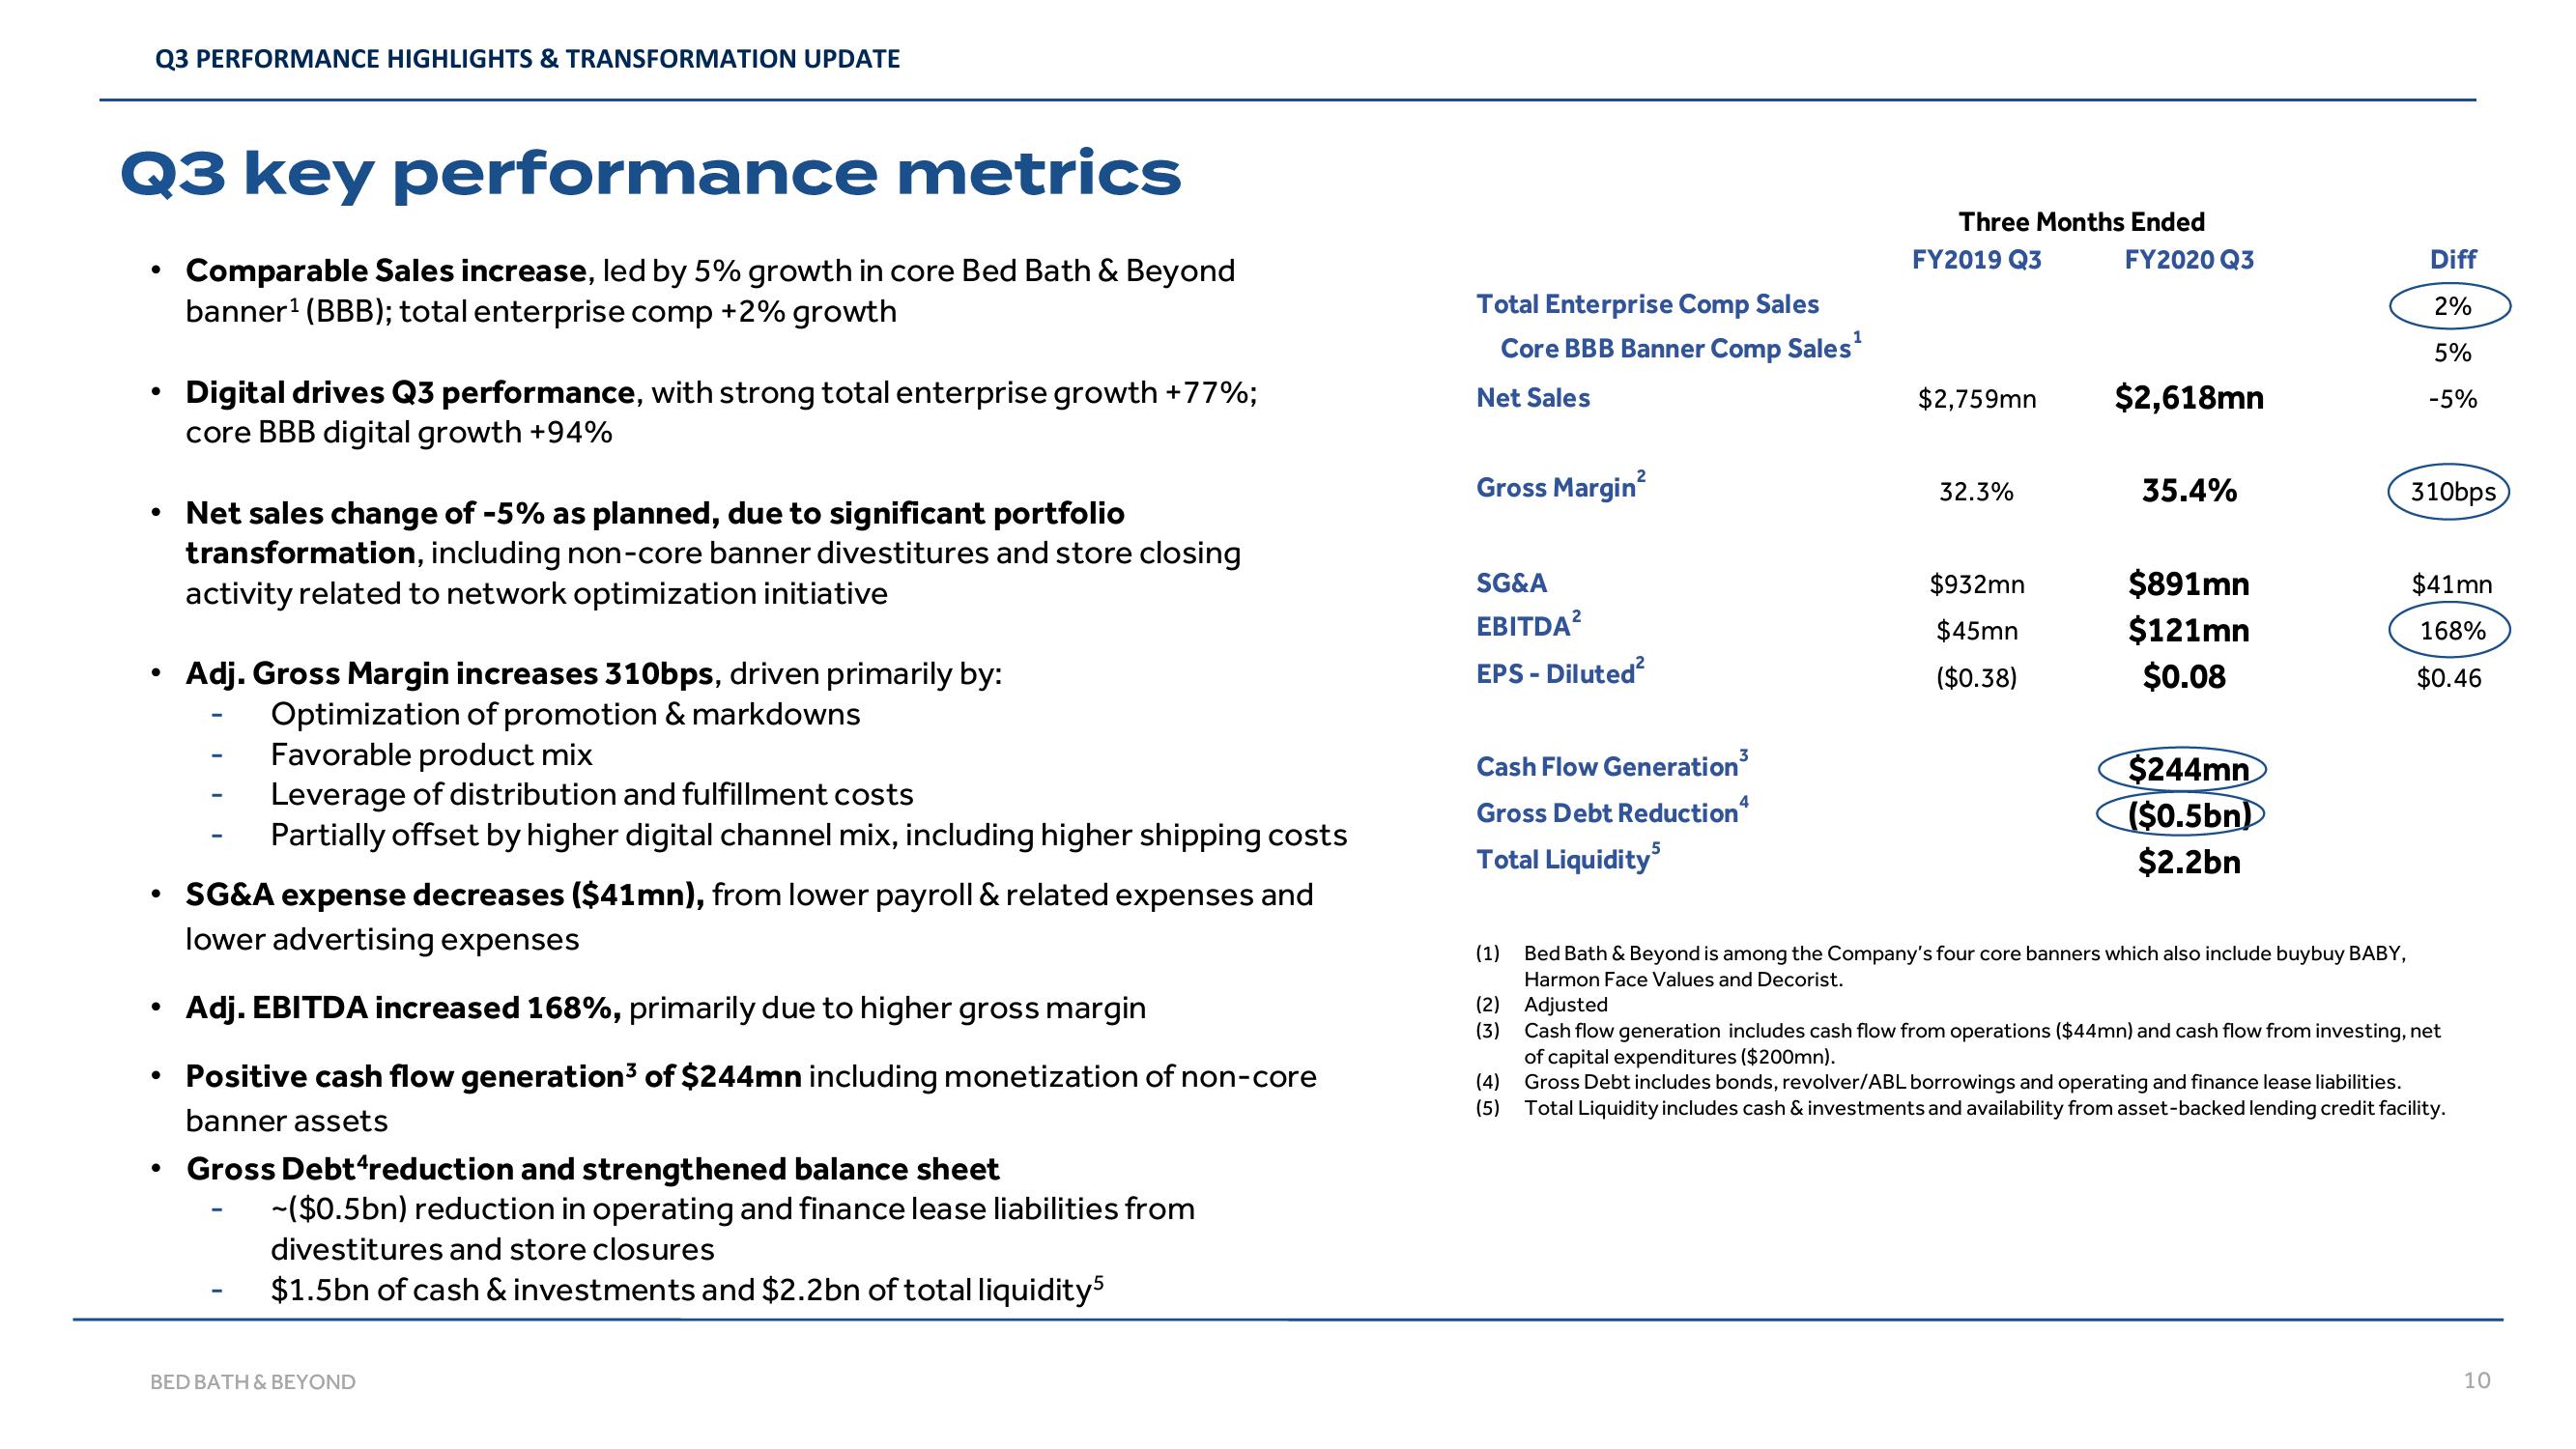
Comparable Sales increase, led by 5% growth in core Bed Bath & Beyond
banner¹ (BBB); total enterprise comp +2% growth
●
●
• Net sales change of -5% as planned, due to significant portfolio
transformation, including non-core banner divestitures and store closing
activity related to network optimization initiative
●
●
●
Digital drives Q3 performance, with strong total enterprise growth +77%;
core BBB digital growth +94%
●
Adj. Gross Margin increases 310bps, driven primarily by:
Optimization of promotion & markdowns
Favorable product mix
Leverage of distribution and fulfillment costs
Partially offset by higher digital channel mix, including higher shipping costs
SG&A expense decreases ($41mn), from lower payroll & related expenses and
lower advertising expenses
Adj. EBITDA increased 168%, primarily due to higher gross margin
Positive cash flow generation³ of $244mn including monetization of non-core
banner assets
Gross Debt reduction and strengthened balance sheet
-($0.5bn) reduction in operating and finance lease liabilities from
divestitures and store closures
$1.5bn of cash & investments and $2.2bn of total liquidity5
BED BATH & BEYOND
Total Enterprise Comp Sales
Core BBB Banner Comp Sales¹
Net Sales
Gross Margin²
SG&A
EBITDA²
EPS - Diluted²
Cash Flow Generation³
Gross Debt Reduction
Total Liquidity5
(1)
(2)
(3)
(4)
(5)
Three Months Ended
FY2019 Q3
FY2020 Q3
$2,759mn
32.3%
$932mn
$45mn
($0.38)
$2,618mn
35.4%
$891mn
$121mn
$0.08
$244mn
($0.5bn)
$2.2bn
Bed Bath & Beyond is among the Company's four core banners which also include buybuy BABY,
Harmon Face Values and Decorist.
Adjusted
Diff
2%
5%
-5%
310bps
$41mn
168%
$0.46
Cash flow generation includes cash flow from operations ($44mn) and cash flow from investing, net
of capital expenditures ($200mn).
Gross Debt includes bonds, revolver/ABL borrowings and operating and finance lease liabilities.
Total Liquidity includes cash & investments and availability from asset-backed lending credit facility.
10View entire presentation