Pershing Square Activist Presentation Deck
V. Developing a Response to the
Company
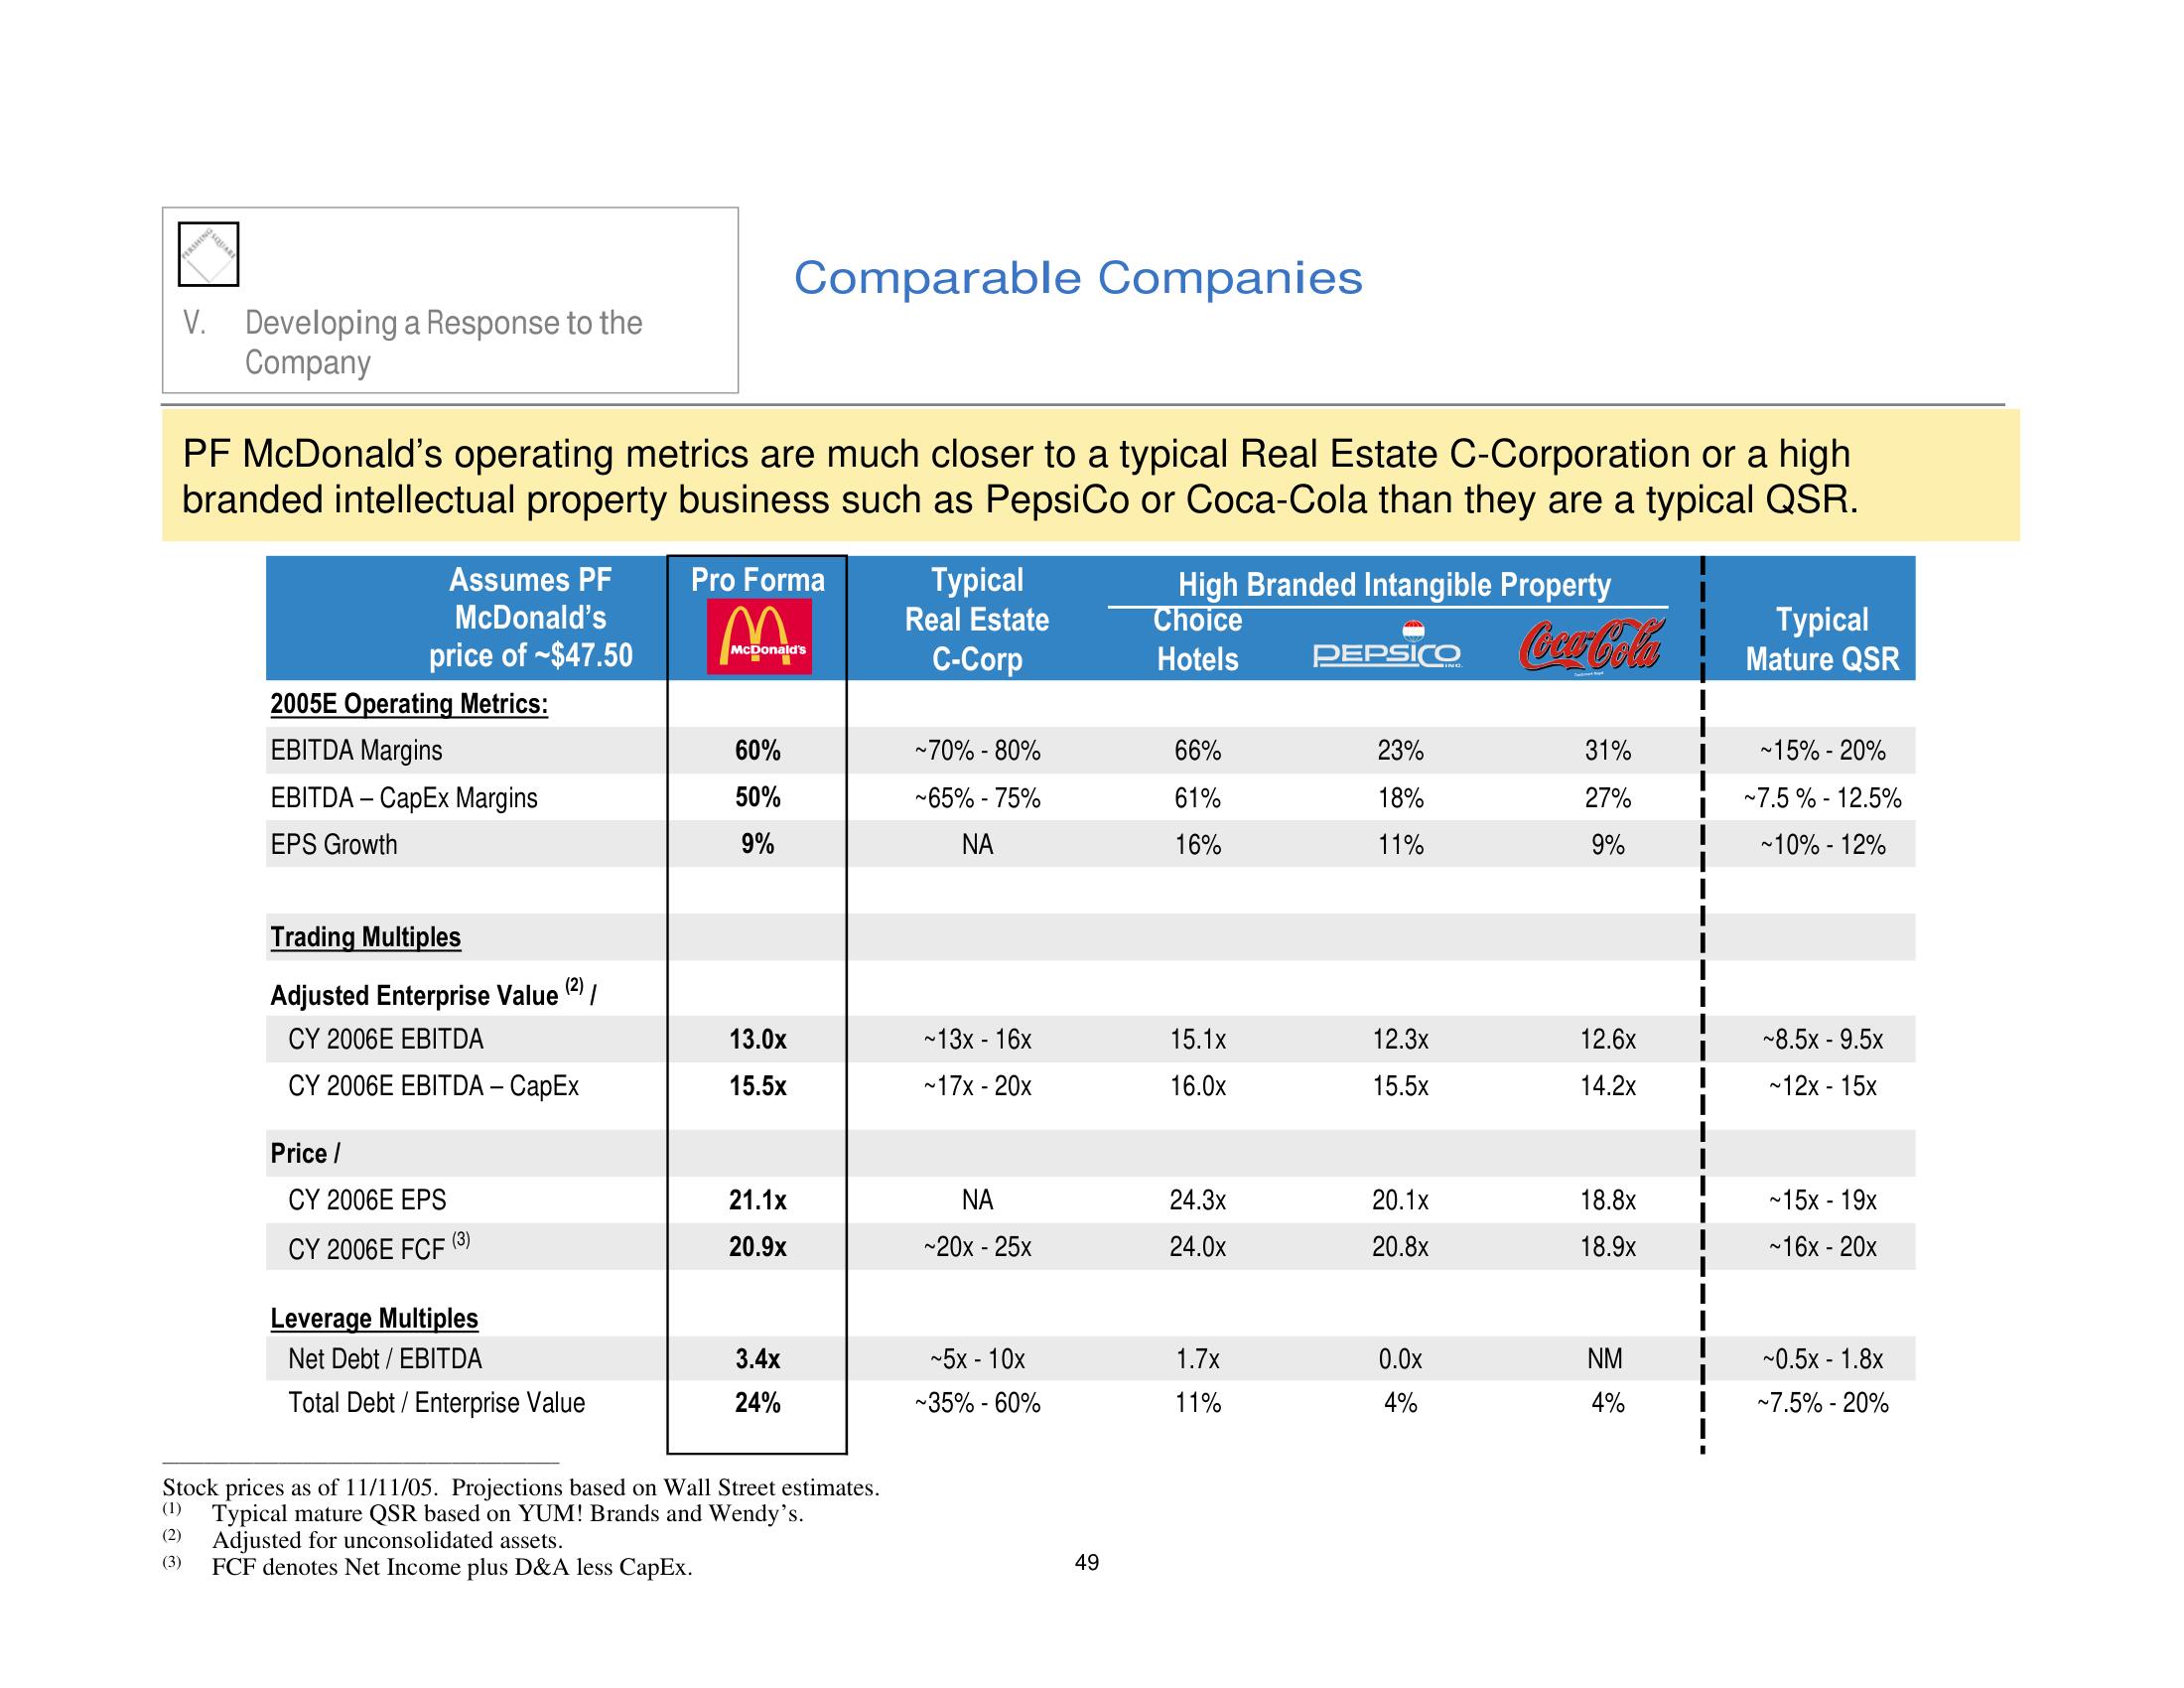
PF McDonald's operating metrics are much closer to a typical Real Estate C-Corporation or a high
branded intellectual property business such as PepsiCo or Coca-Cola than they are a typical QSR.
Assumes PF
McDonald's
price of $47.50
2005E Operating Metrics:
EBITDA Margins
EBITDA - CapEx Margins
EPS Growth
Trading Multiples
Adjusted Enterprise Value (2) /
CY 2006E EBITDA
CY 2006E EBITDA - CapEx
Price /
CY 2006E EPS
CY 2006E FCF
(3)
Leverage Multiples
Net Debt / EBITDA
Total Debt / Enterprise Value
Pro Forma
McDonald's
60%
50%
9%
Comparable Companies
13.0x
15.5x
21.1x
20.9x
3.4x
24%
Stock prices as of 11/11/05. Projections based on Wall Street estimates.
(1) Typical mature QSR based on YUM! Brands and Wendy's.
(2)
Adjusted for unconsolidated assets.
(3)
FCF denotes Net Income plus D&A less CapEx.
Typical
Real Estate
C-Corp
~70% -80%
~65% -75%
NA
~13x - 16x
~17x - 20x
ΝΑ
~20x - 25x
~5x - 10x
~35% - 60%
49
High Branded Intangible Property
Choice
Hotels
66%
61%
16%
15.1x
16.0x
24.3x
24.0x
1.7x
11%
PEPSICO
23%
18%
11%
12.3x
15.5×
20.1x
20.8x
0.0x
4%
Coca-Cola
31%
27%
9%
12.6x
14.2x
18.8x
18.9x
NM
4%
Typical
Mature QSR
~15% - 20%
~7.5% -12.5%
~10% -12%
~8.5x - 9.5x
~12x - 15x
~15x - 19x
~16x - 20x
~0.5x - 1.8x
~7.5% - 20%View entire presentation