Bank of America Investment Banking Pitch Book
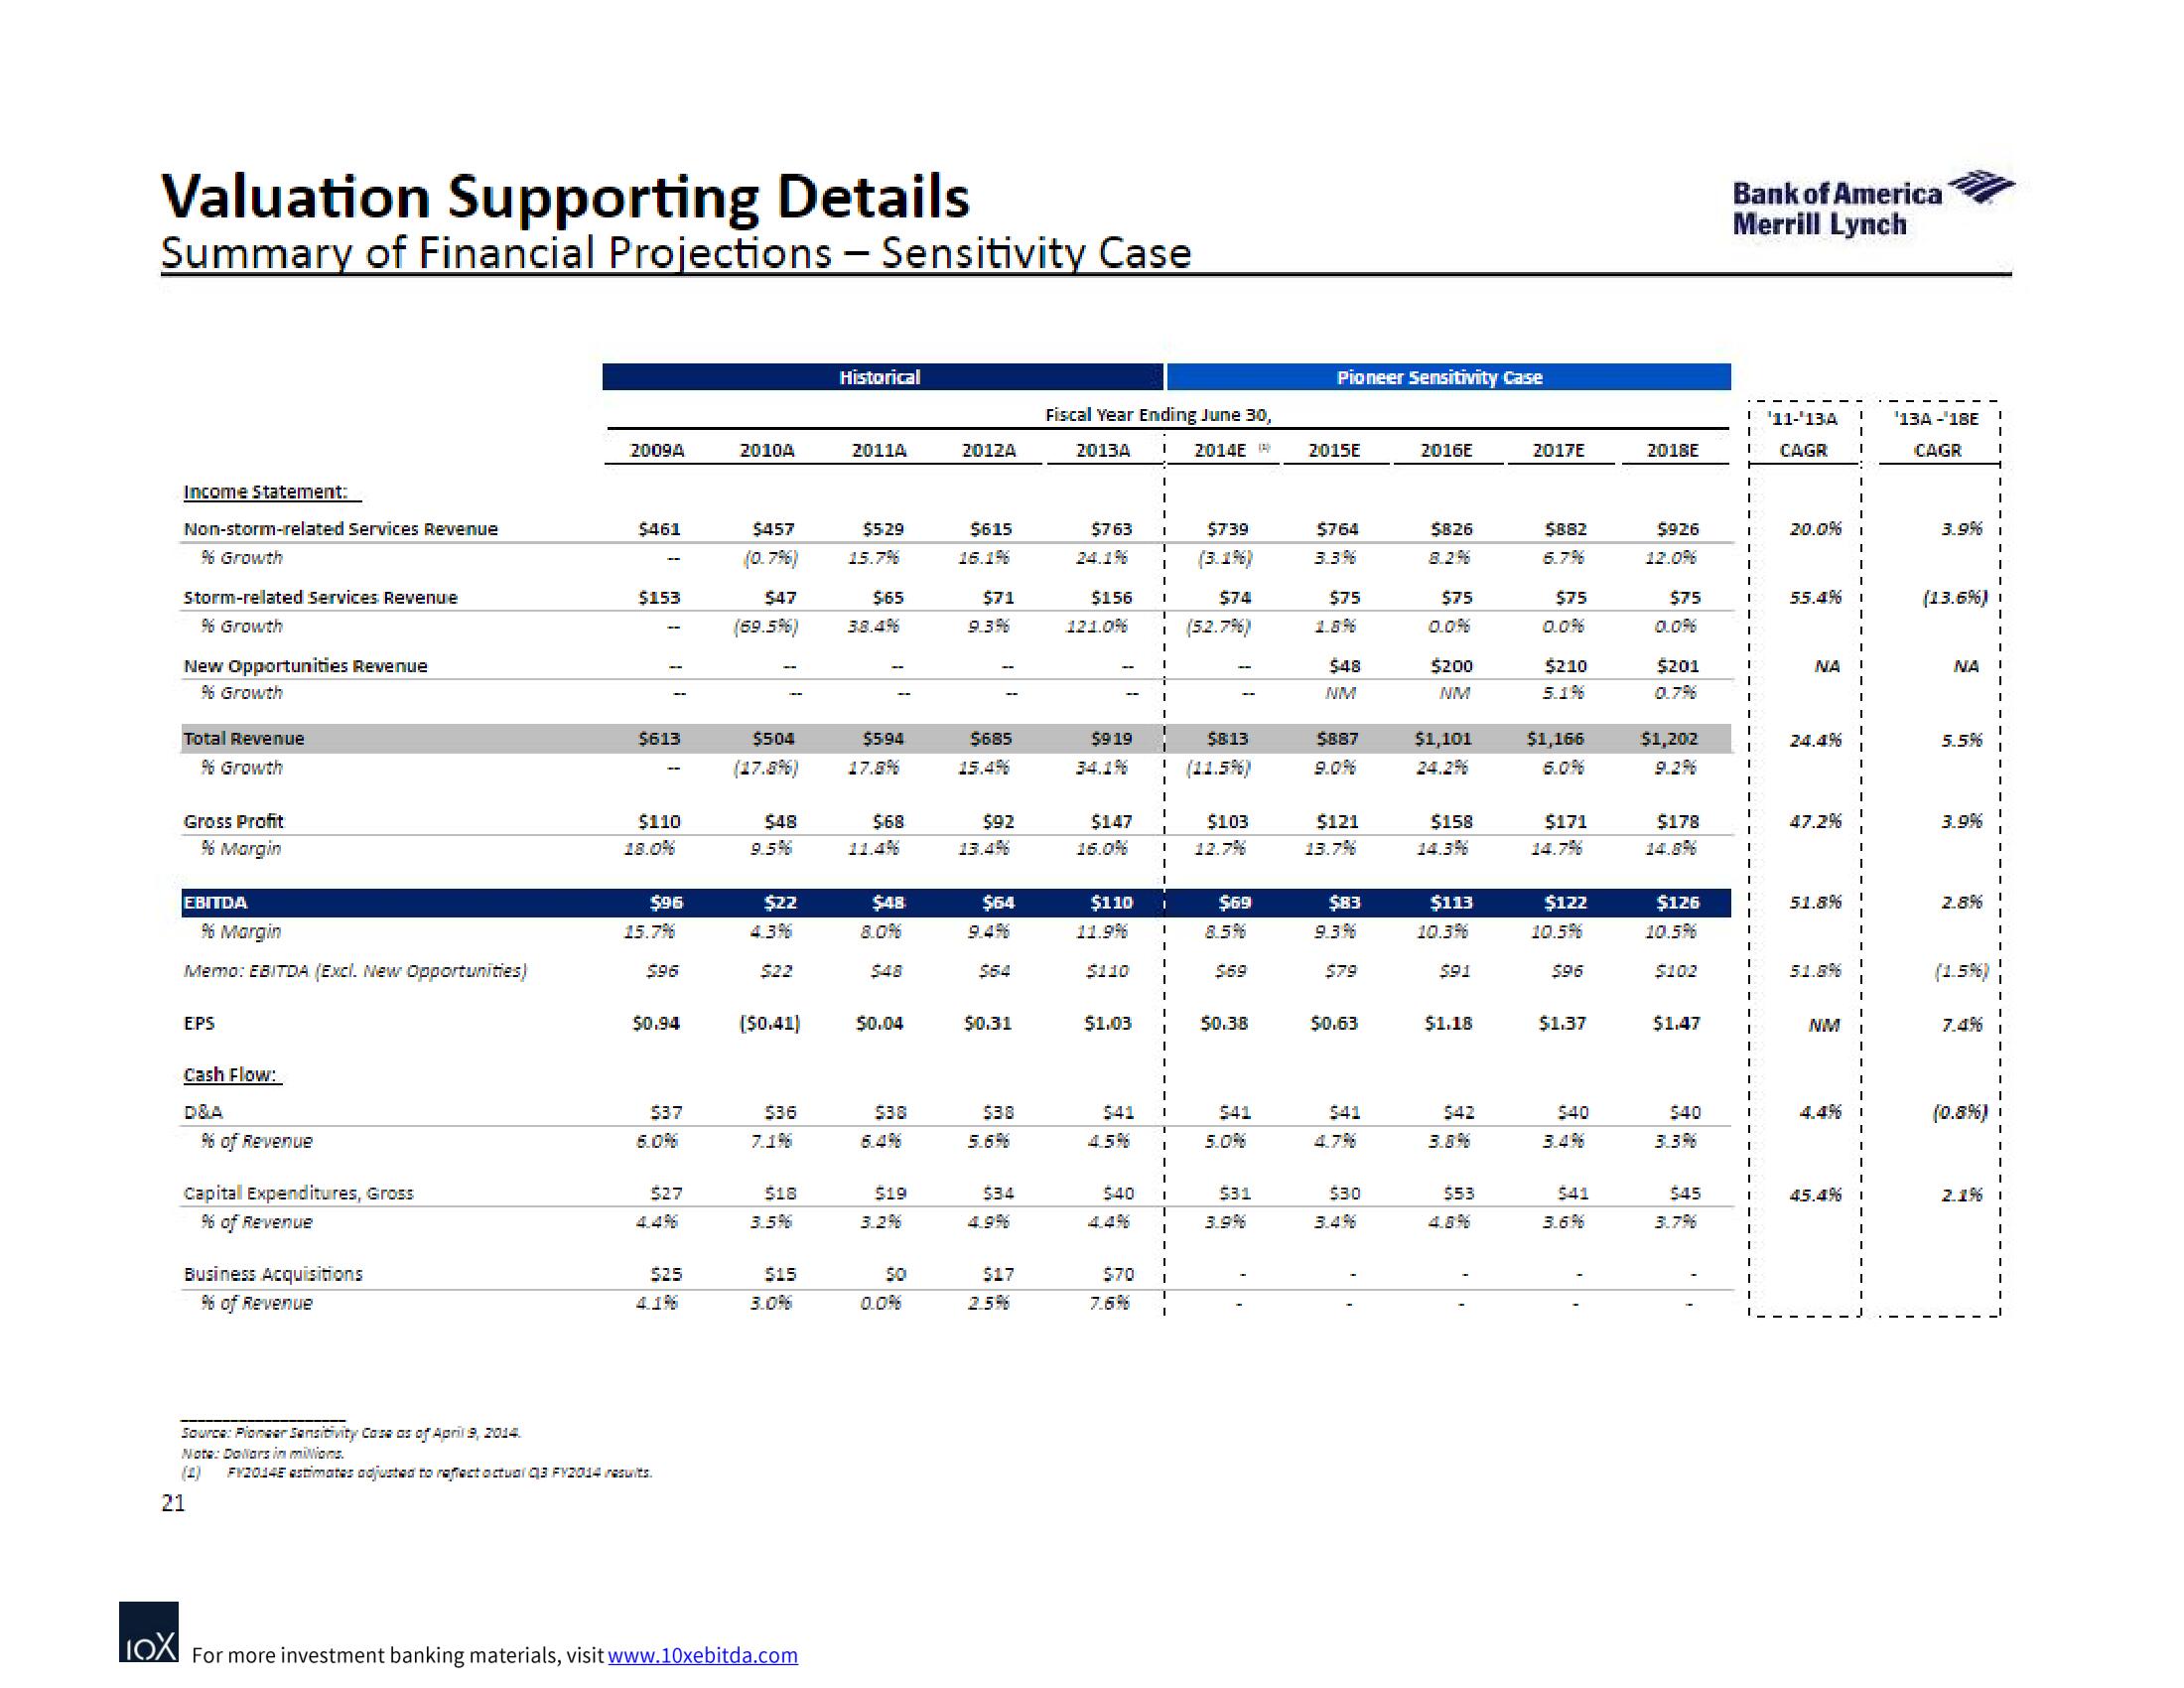
Valuation Supporting Details
Summary of Financial Projections - Sensitivity Case
Income Statement:
Non-storm-related Services Revenue
96 Growth
Storm-related Services Revenue
96 Growth
New Opportunities Revenue
96 Growth
Total Revenue
96 Growth
Gross Profit
% Margin
21
EBITDA
% Margin
Memo: EBITDA (Excl. New Opportunities)
EPS
Cash Flow:
D&A
96 of Revenue
Capital Expenditures, Gross
%6 of Revenue
Business Acquisitions
96 of Revenue
Source: Pioneer Sensitivity Cosa as of April 9, 2014.
Note: Dollars in milions.
2009A
$461
$153
$613
$110
$96
15.7%
5.96
$0.94
$37
527
$25
FY2014 estimates adjusted to reflect actual q3 FY2014 results.
2010A
$457
$504
(17.896)
$48
$65
$47
(69.5%) 3.8.4%
9.5%
$22
4.396
$22
[$0.41)
$36
$18
3.5%
$15
Historical
LOX For more investment banking materials, visit www.10xebitda.com
2011A
$5.29
15.7%
$5.94
17.8%
$68
$48
$48
50.04
$38
$19
50
2012A
$615
16.1%
$71
9.396
$685
15.4%
$92
$64
$0.31
$38
$34
$17
2.5%
Fiscal Year Ending June 30,
2013A I 2014E
$763
24.196
$156
121.096
$919
34.1%
$110
11.9%
I
$147
16.0% I
I
$110
$1.03
$41
540
I
$70
I
I
I
$739
(3.196)
I
I
$74
(5.2.7%)
$813
(11.5%)
$103
I
I 8.5%
$69
$69
$0.38
$41
531
3.9%
Pioneer Sensitivity Case
2015E
$764
3.3%
$75
$48
NM
$887
$121
13.7%
$83
9.3%
$79
$0.63
$41
530
2016E
$826
$75
$200
NM
$1,101
$158
14.3%
$113
10.3%
$.91
$1.18
$42
3.8%
$53
2017E
$882
6.7%
$75
$210
5.1%
$1,166
$171
14.7%
$122
10.5%
$1.37
$40
541
3.6%
2018E
$926
12.09
$75
0.096
$201
0.796
$1,202
$178
$126
10.5%
$102
$1.47
$40
3.396
$45
3.7%
Bank of America
Merrill Lynch
I
'11-'13A
CAGR
20.0%
55.4%
NA
24.4%
47.2%
51.8%
51.8%
NM
4.4%
45.4%
¹13A-18E
CAGR
3.9%
(13.6%)
NA
5.5%
3.9%
2.8%
(1.596)
(0.8%)
2.1%View entire presentation