Enact IPO Presentation Deck
Enact | Investor Presentation
Summary Historical Financials
($ in millions, unless noted otherwise)
ROE:
$129
2016
$484
2018
17%
$3,274
$143
2017
Primary IIF ($B)¹
CAGR (16-20): 12.6%
$157
2018
2019
$182
Adjusted Operating Income
$562
16%
2019
$3,827
$373
Stockholders' Equity
10%
2020
$208
$3,882
2020
$217
20¹21
$491
LTM 2021
13%
$4,090
20′21
5%
$43
Combined 31%
Ratio:
26%
Dividends*:
2016
2018
$50
129%
$39
2017
6%
NIW ($B)
CAGR ('16-'20): 23.6%
2018
30%
25%
$40
2019
Loss / Expense Ratio
63%
24%
$62
138%
2019
39%
2020
PMIERS Sufficiency³
$250
$437
137%
$100
2020
2018
2019
2020
2018
2019
2020
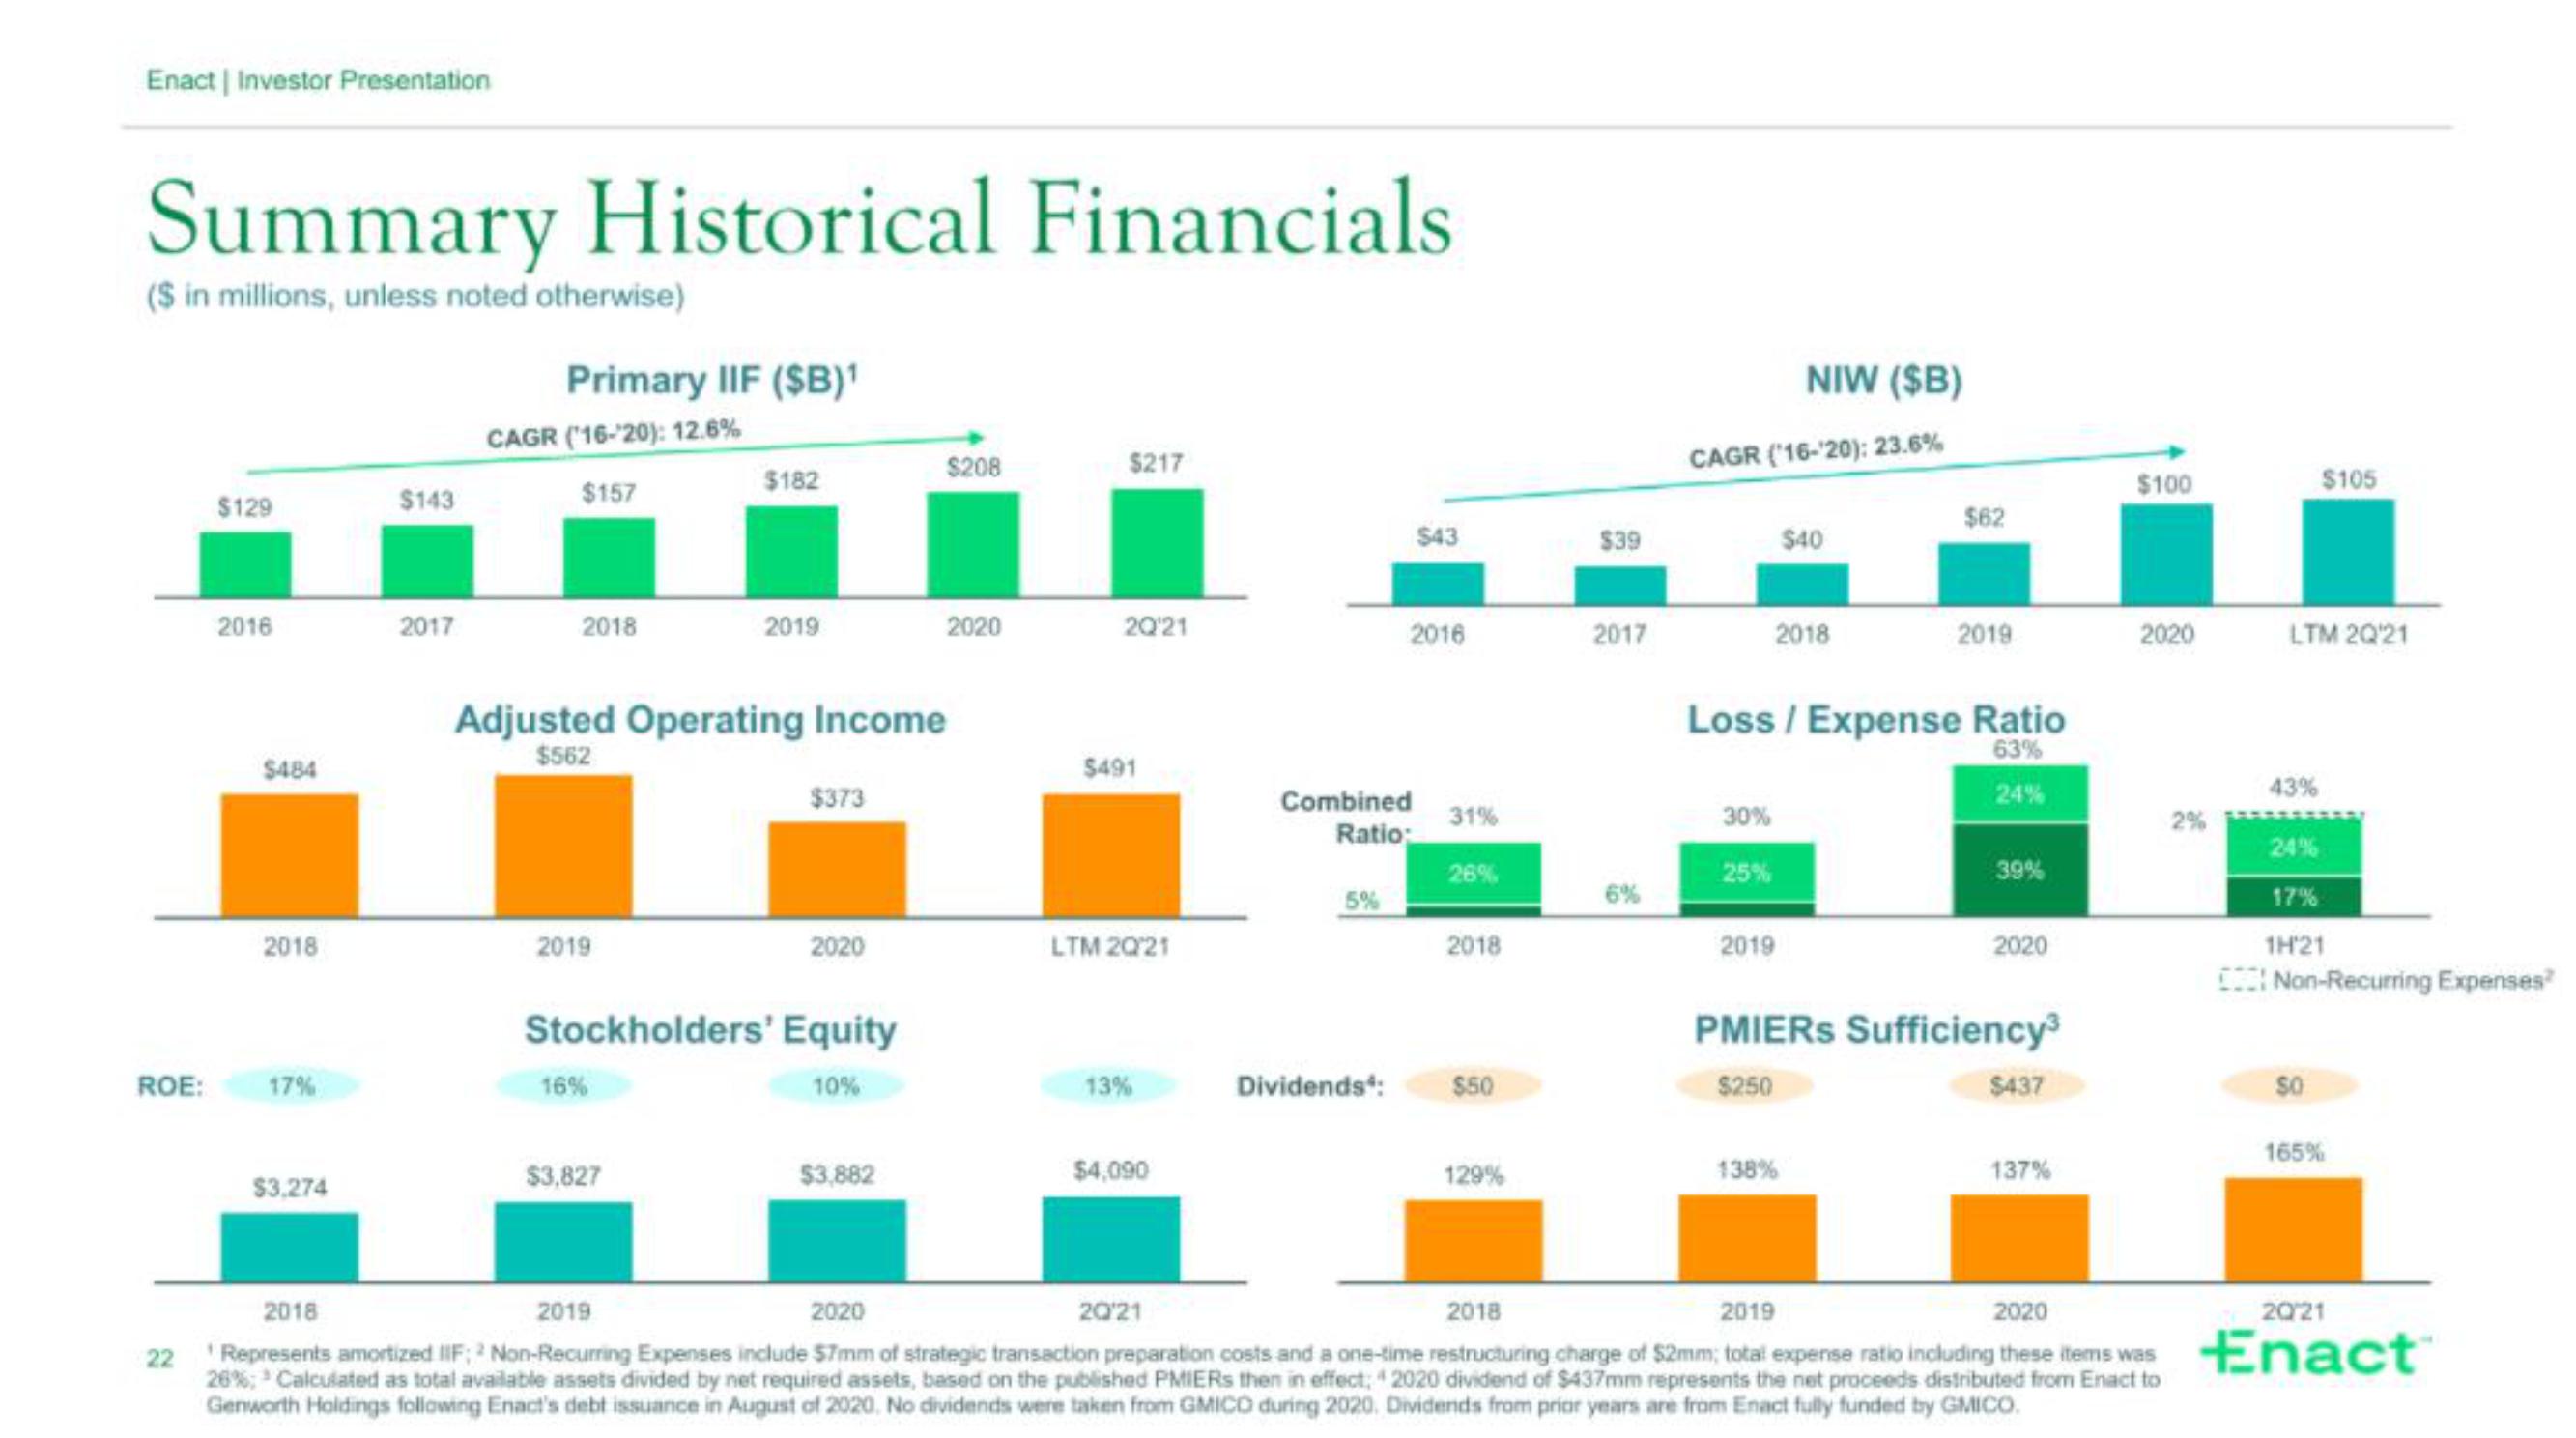
22 Represents amortized IIF; 2 Non-Recurring Expenses include $7mm of strategic transaction preparation costs and a one-time restructuring charge of $2mm; total expense ratio including these items was
26%; Calculated as total available assets divided by net required assets, based on the published PMIERS then in effect; 2020 dividend of $437mm represents the net proceeds distributed from Enact to
Genworth Holdings following Enact's debt issuance in August of 2020. No dividends were taken from GMICO during 2020. Dividends from prior years are from Enact fully funded by GMICO.
2%
LTM 2Q¹21
43%
$105
24%
17%
1H'21
Non-Recurring Expenses?
SO
165%
20/21
EnactView entire presentation