J.P.Morgan Investment Banking Pitch Book
PUBLIC MARKET OVERVIEW
Public market overview
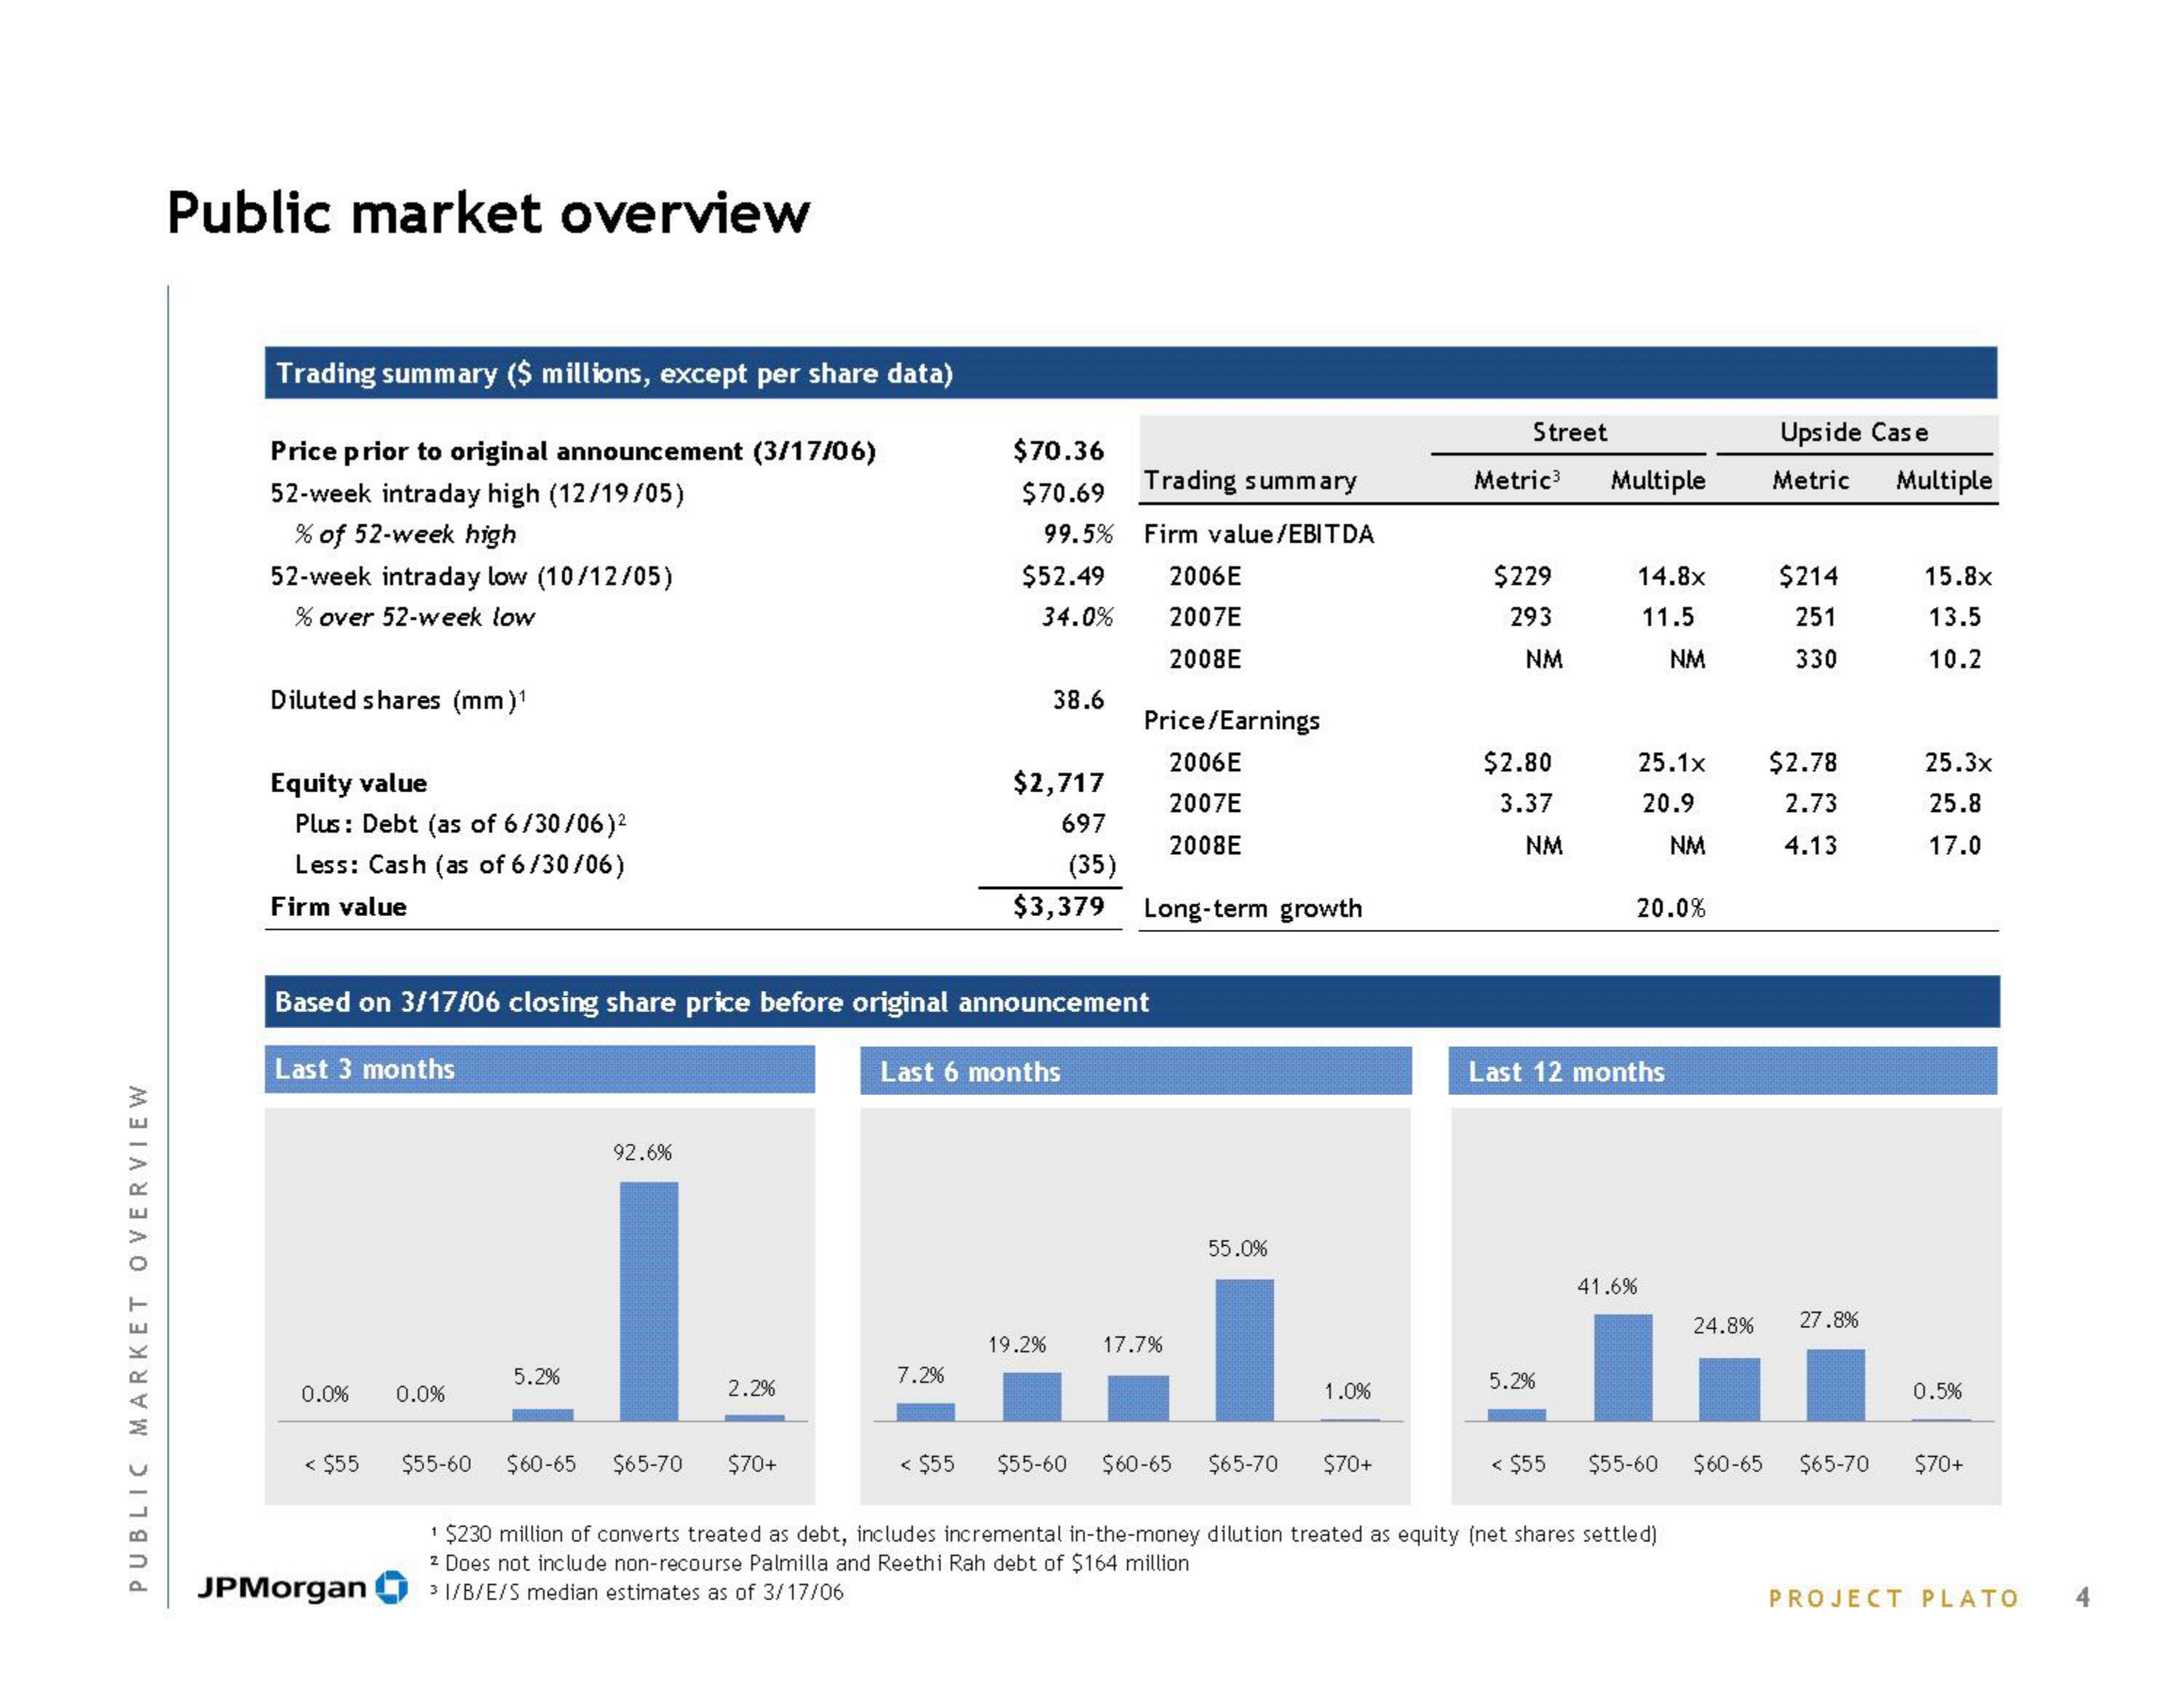
Trading summary ($ millions, except per share data)
Price prior to original announcement (3/17/06)
52-week intraday high (12/19/05)
% of 52-week high
52-week intraday low (10/12/05)
% over 52-week low
Diluted shares (mm)¹
Equity value
Plus: Debt (as of 6/30/06)²
Less: Cash (as of 6/30/06)
Firm value
0.0%
< $55
JPMorgan
0.0%
5.2%
92.6%
2.2%
Based on 3/17/06 closing share price before original announcement
Last 3 months
Last 6 months
$70.36
$70.69
99.5%
7.2%
$55-60 $60-65 $65-70 $70+
$52.49
34.0%
38.6
$2,717
697
Trading summary
Firm value/EBITDA
19.2%
Price/Earnings
2006E
2007E
2008E
(35)
$3,379 Long-term growth
2006E
2007E
2008E
17.7%
55.0%
1.0%
Street
Metric³ Multiple
$229
293
NM
$2.80
3.37
NM
5.2%
14.8x
11.5
Last 12 months
41.6%
25.1x
20.9
20.0%
< $55 $55-60 $60-65 $65-70 $70+
1 $230 million of converts treated as debt, includes incremental in-the-money dilution treated as equity (net shares settled)
z Does not include non-recourse Palmilla and Reethi Rah debt of $164 million
3 I/B/E/S median estimates as of 3/17/06
NM
< $55 $55-60
NM
Upside Case
Metric
$214
251
330
$2.78
2.73
4.13
24.8% 27.8%
$60-65 $65-70
Multiple
15.8x
13.5
10.2
25.3x
25.8
17.0
0.5%
$70+
PROJECT PLATO
4View entire presentation