Udemy Results Presentation Deck
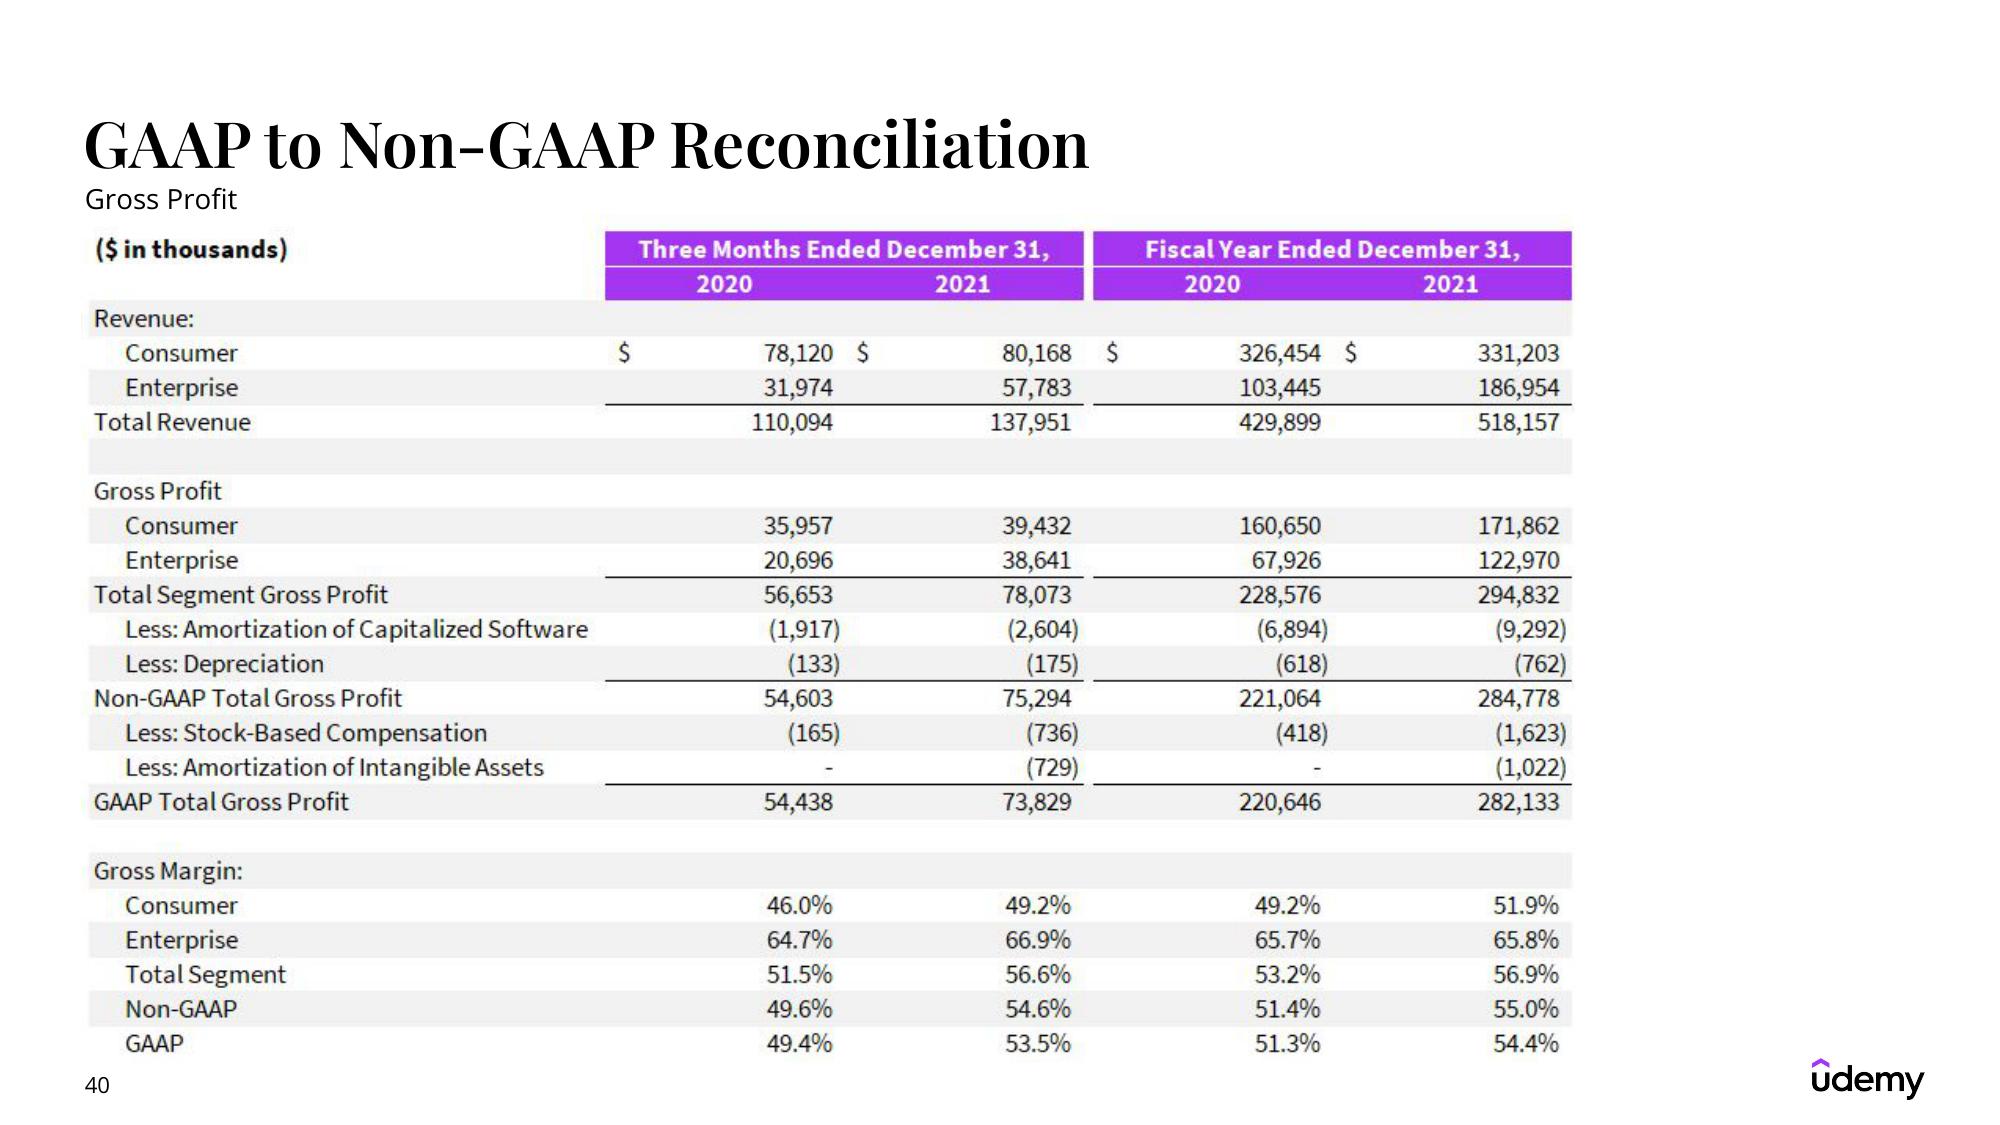
GAAP to Non-GAAP Reconciliation
Gross Profit
($ in thousands)
Revenue:
Consumer
Enterprise
Total Revenue
Gross Profit
Consumer
Enterprise
Total Segment Gross Profit
Less: Amortization of Capitalized Software
Less: Depreciation
Non-GAAP Total Gross Profit
Less: Stock-Based Compensation
Less: Amortization of Intangible Assets
GAAP Total Gross Profit
Gross Margin:
Consumer
Enterprise
Total Segment
Non-GAAP
GAAP
40
Three Months Ended December 31,
2020
2021
78,120 $
31,974
110,094
35,957
20,696
56,653
(1,917)
(133)
54,603
(165)
54,438
46.0%
64.7%
51.5%
49.6%
49.4%
80,168 $
57,783
137,951
39,432
38,641
78,073
(2,604)
(175)
75,294
(736)
(729)
73,829
49.2%
66.9%
56.6%
54.6%
53.5%
Fiscal Year Ended December 31,
2020
2021
326,454 $
103,445
429,899
160,650
67,926
228,576
(6,894)
(618)
221,064
(418)
220,646
49.2%
65.7%
53.2%
51.4%
51.3%
331,203
186,954
518,157
171,862
122,970
294,832
(9,292)
(762)
284,778
(1,623)
(1,022)
282,133
51.9%
65.8%
56.9%
55.0%
54.4%
ûdemyView entire presentation