Bausch+Lomb Results Presentation Deck
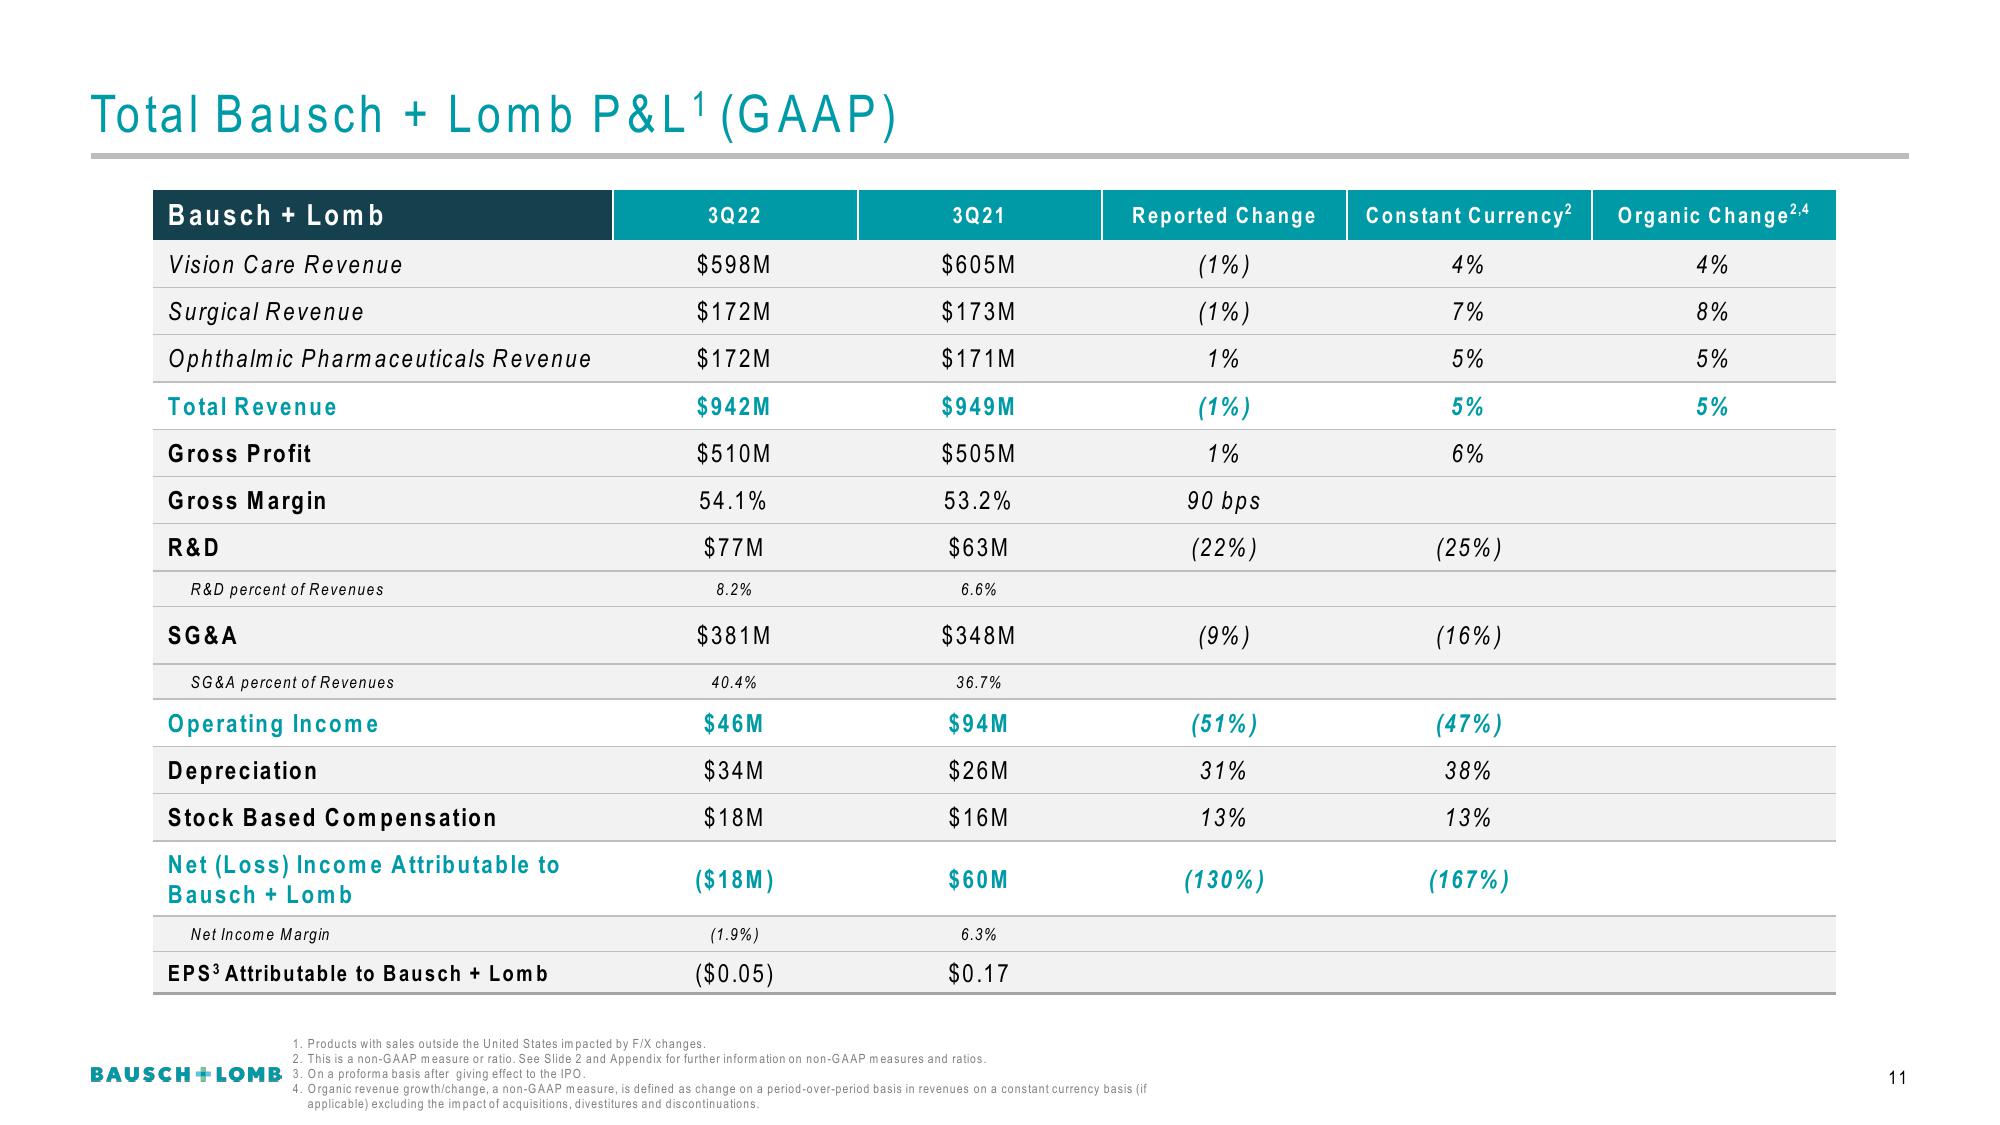
Total Bausch + Lomb P&L¹ (GAAP)
Bausch + Lomb
Vision Care Revenue
Surgical Revenue
Ophthalmic Pharmaceuticals Revenue
Total Revenue
Gross Profit
Gross Margin
R&D
R&D percent of Revenues
SG&A
SG&A percent of Revenues
Operating Income
Depreciation
Stock Based Compensation
Net (Loss) Income Attributable to
Bausch+Lomb
Net Income Margin
EPS³ Attributable to Bausch + Lomb
3Q22
$598M
$172M
$172M
$942M
$510M
54.1%
$77M
8.2%
BAUSCH + LOMB 3. On a proforma basis after giving effect to the IPO.
$381M
40.4%
$46M
$34M
$18M
($18M)
(1.9%)
($0.05)
3Q21
$605M
$173M
$171M
$949M
$505M
53.2%
$63M
6.6%
$348M
36.7%
$94M
$26M
$16M
$60M
6.3%
$0.17
1. Products with sales outside the United States impacted by F/X changes.
2. This is a non-GAAP measure or ratio. See Slide 2 and Appendix for further information on non-GAAP measures and ratios.
Reported Change
(1%)
(1%)
1%
4. Organic revenue growth/change, a non-GAAP measure, is defined as change on a period-over-period basis in revenues on a constant currency basis (if
applicable) excluding the impact of acquisitions, divestitures and discontinuations.
(1%)
1%
90 bps
(22%)
(9%)
(51%)
31%
13%
(130%)
Constant Currency²
4%
7%
5%
5%
6%
(25%)
(16%)
(47%)
38%
13%
(167%)
Organic Change 2,4
4%
8%
5%
5%
11View entire presentation