J.P.Morgan Results Presentation Deck
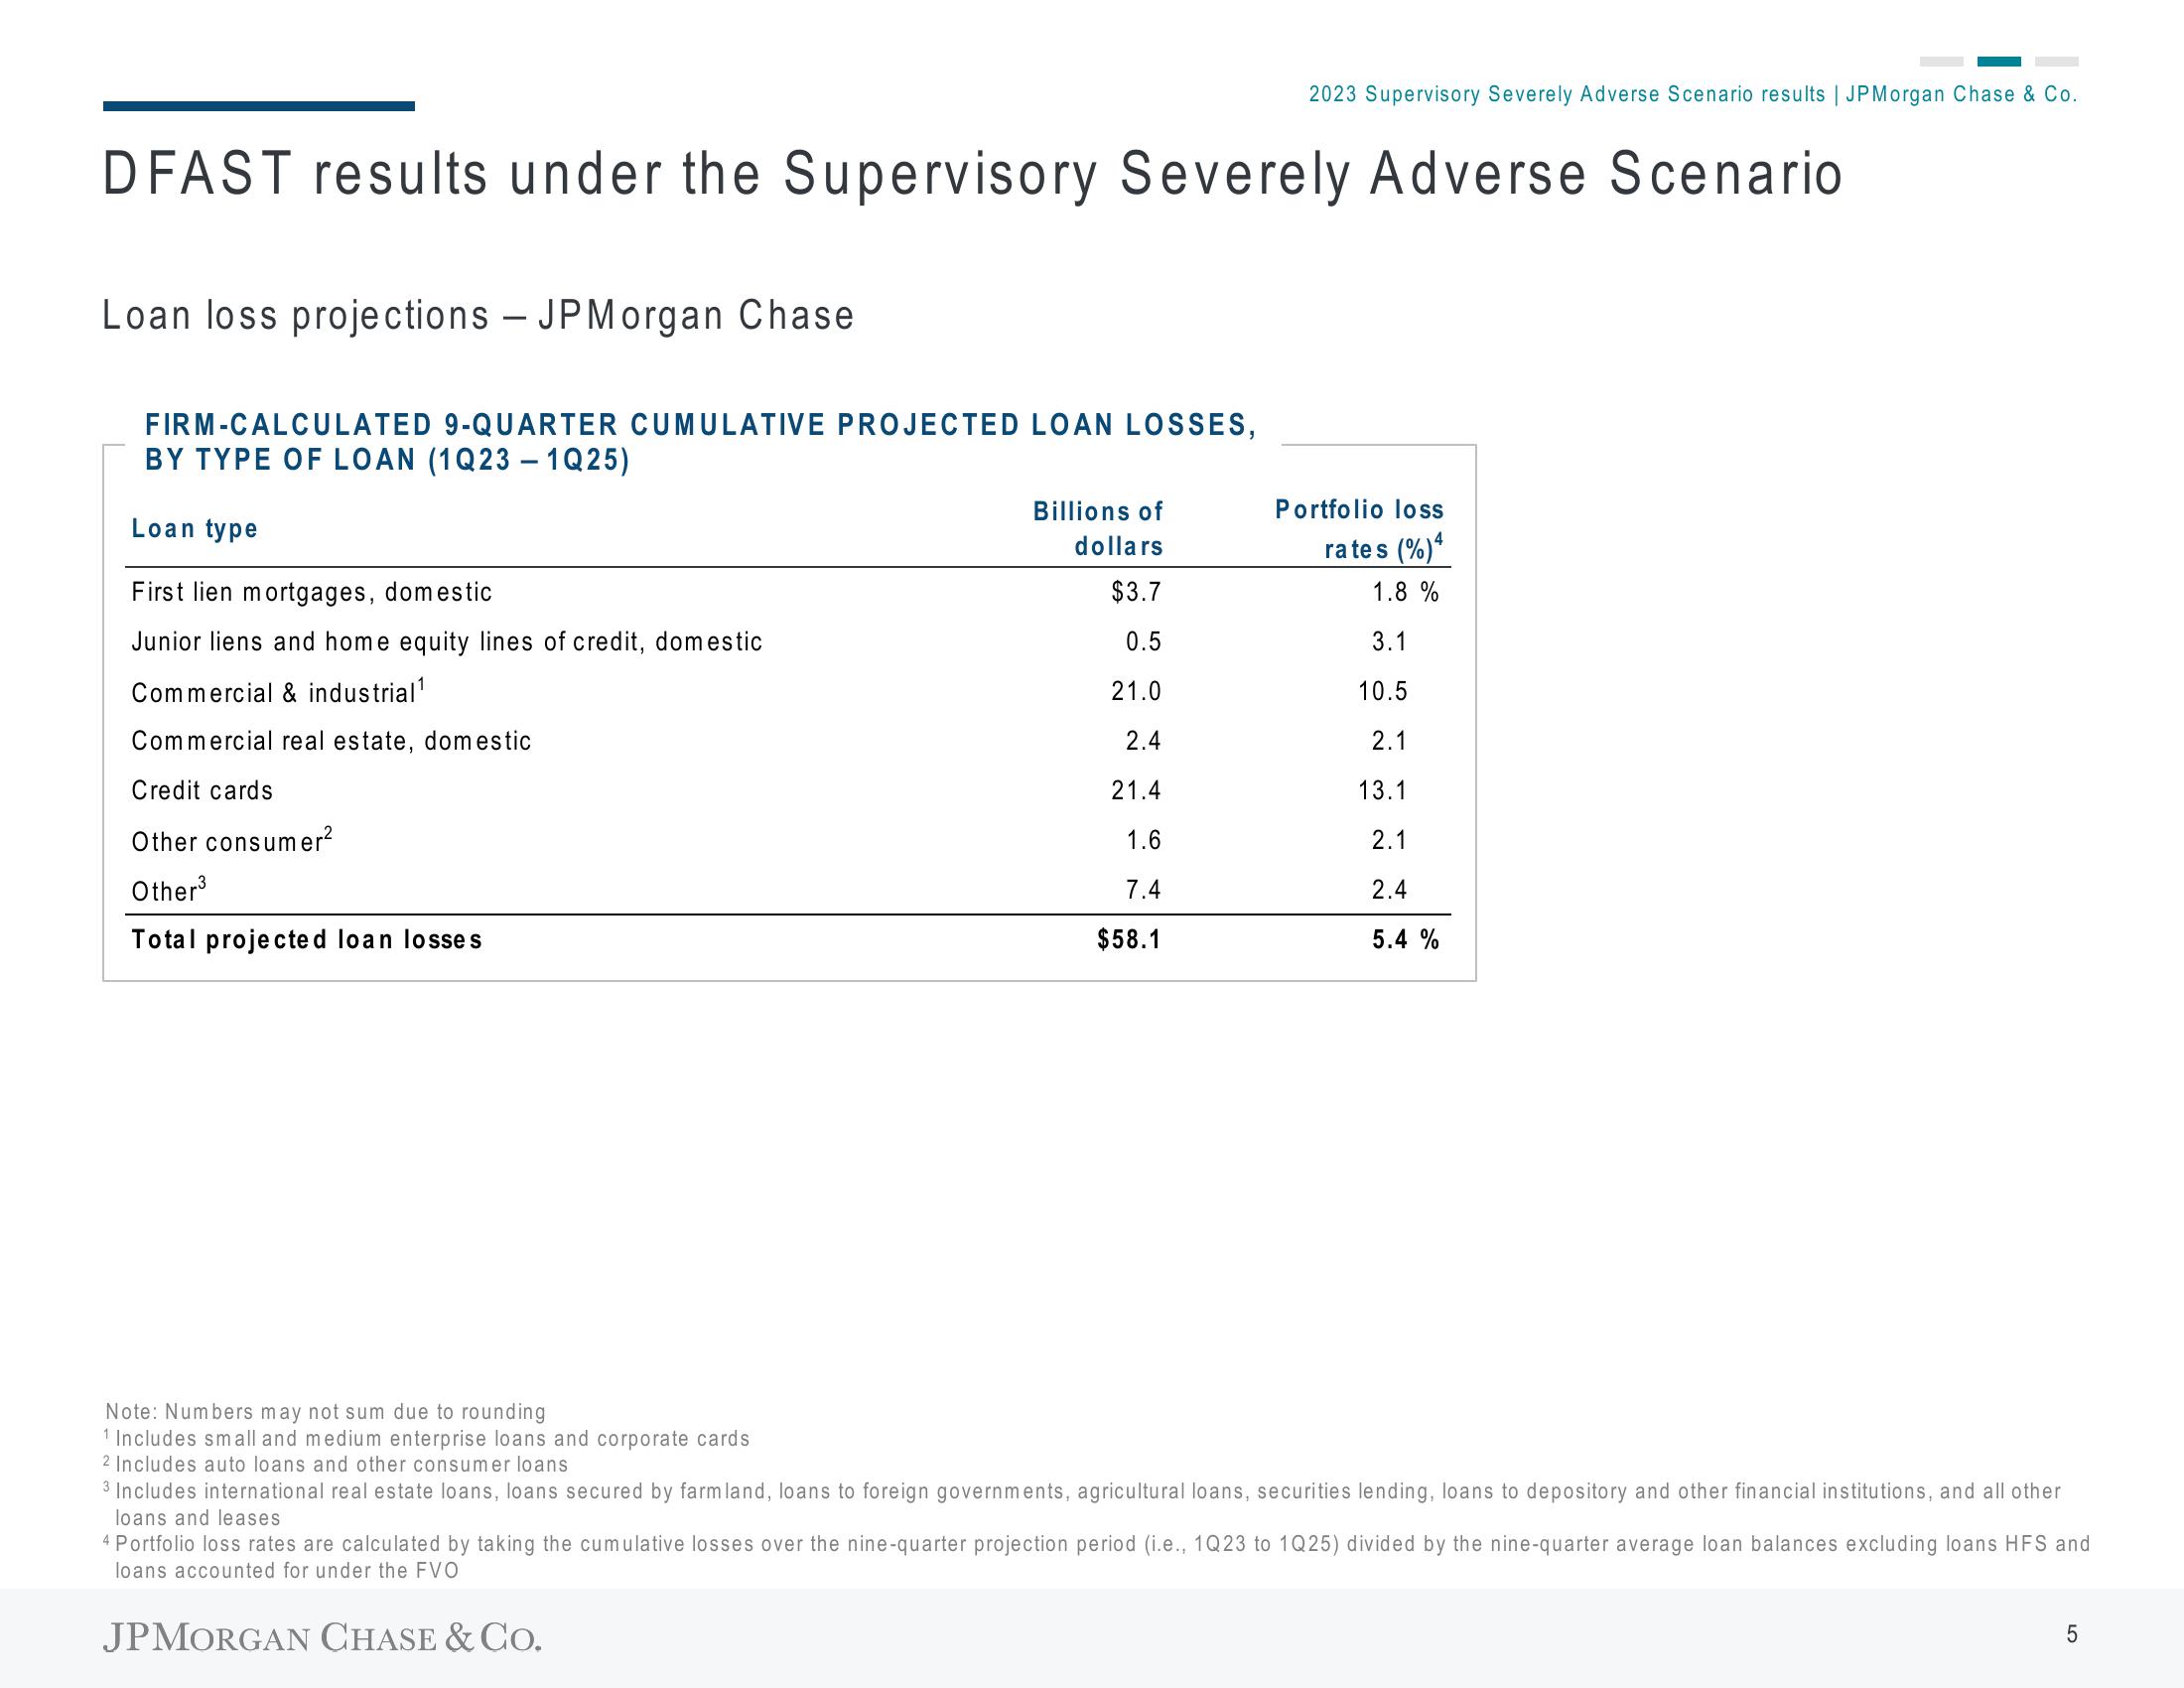
DFAST results under the Supervisory Severely Adverse Scenario
Loan loss projections - JPMorgan Chase
FIRM-CALCULATED 9-QUARTER CUMULATIVE PROJECTED LOAN LOSSES,
BY TYPE OF LOAN (1Q23 - 1Q25)
Loan type
First lien mortgages, domestic
Junior liens and home equity lines of credit, domestic
Commercial & industrial¹
Commercial real estate, domestic
Credit cards
Other consumer²
Other³
Total projected loan losses
2023 Supervisory Severely Adverse Scenario results | JPMorgan Chase & Co.
Billions of
dollars
$3.7
0.5
21.0
2.4
21.4
1.6
7.4
$58.1
Portfolio loss
rates (%) 4
1.8 %
3.1
10.5
2.1
13.1
2.1
2.4
5.4 %
Note: Numbers may not sum due to rounding
¹ Includes small and medium enterprise loans and corporate cards
2 Includes auto loans and other consumer loans
3 Includes international real estate loans, loans secured by farm land, loans to foreign governments, agricultural loans, securities lending, loans to depository and other financial institutions, and all other
loans and leases
4 Portfolio loss rates are calculated by taking the cumulative losses over the nine-quarter projection period (i.e., 1Q23 to 1Q25) divided by the nine-quarter average loan balances excluding loans HFS and
loans accounted for under the FVO
JPMORGAN CHASE & CO.
5View entire presentation