Owens&Minor Investor Conference Presentation Deck
27
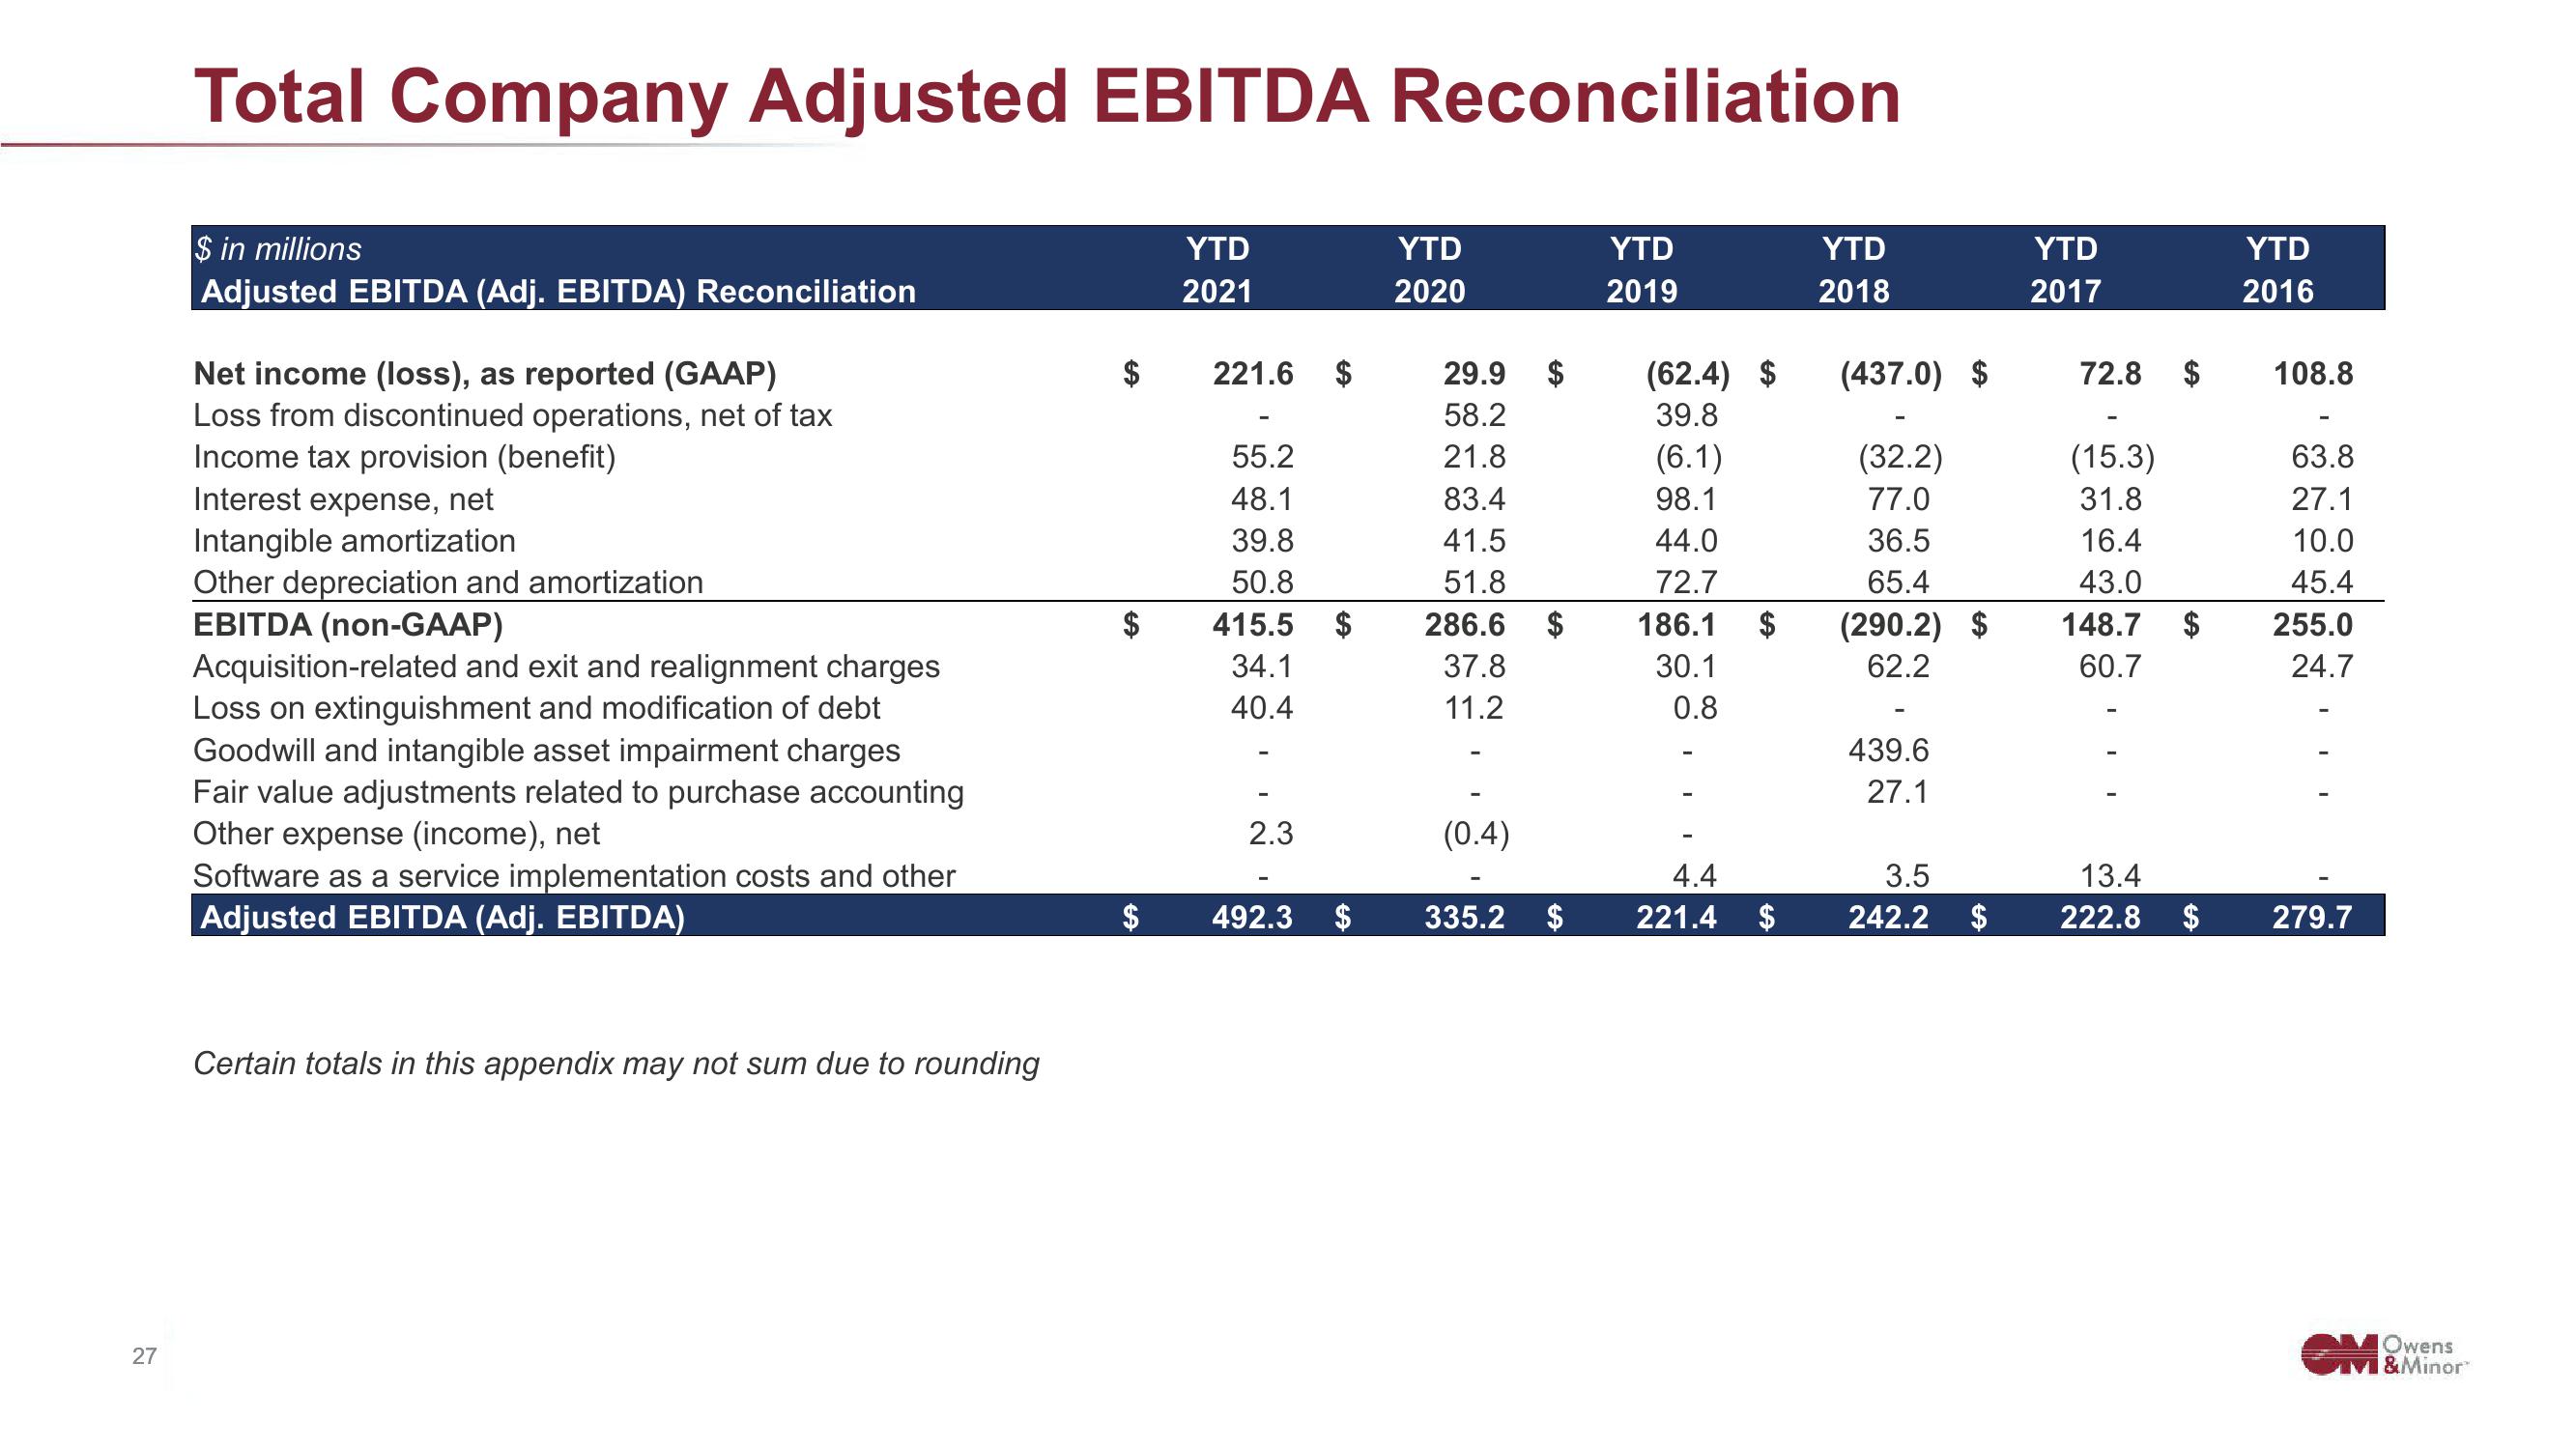
Total Company Adjusted EBITDA Reconciliation
$ in millions
Adjusted EBITDA (Adj. EBITDA) Reconciliation
Net income (loss), as reported (GAAP)
Loss from discontinued operations, net of tax
Income tax provision (benefit)
Interest expense, net
Intangible amortization
Other depreciation and amortization
EBITDA (non-GAAP)
Acquisition-related and exit and realignment charges
Loss on extinguishment and modification of debt
Goodwill and intangible asset impairment charges
Fair value adjustments related to purchase accounting
Other expense (income), net
Software as a service implementation costs and other
Adjusted EBITDA (Adj. EBITDA)
Certain totals in this appendix may not sum due to rounding
$
$
$
YTD
2021
221.6
55.2
48.1
39.8
50.8
415.5
34.1
40.4
2.3
$
$
492.3 $
YTD
2020
29.9 $
58.2
21.8
83.4
41.5
51.8
286.6
37.8
11.2
(0.4)
335.2
YTD
2019
(62.4) $ (437.0) $
39.8
(6.1)
98.1
44.0
72.7
$ 186.1
30.1
0.8
4.4
$ 221.4
$
YTD
2018
$
(32.2)
77.0
36.5
65.4
(290.2) $
62.2
439.6
27.1
3.5
242.2
YTD
2017
72.8
(15.3)
31.8
16.4
43.0
148.7
60.7
13.4
$ 222.8
$
$
$
YTD
2016
108.8
63.8
27.1
10.0
45.4
255.0
24.7
279.7
Owens
VI & MinorView entire presentation