Nestle Results Presentation Deck slide image

Nestle Results Presentation Deck

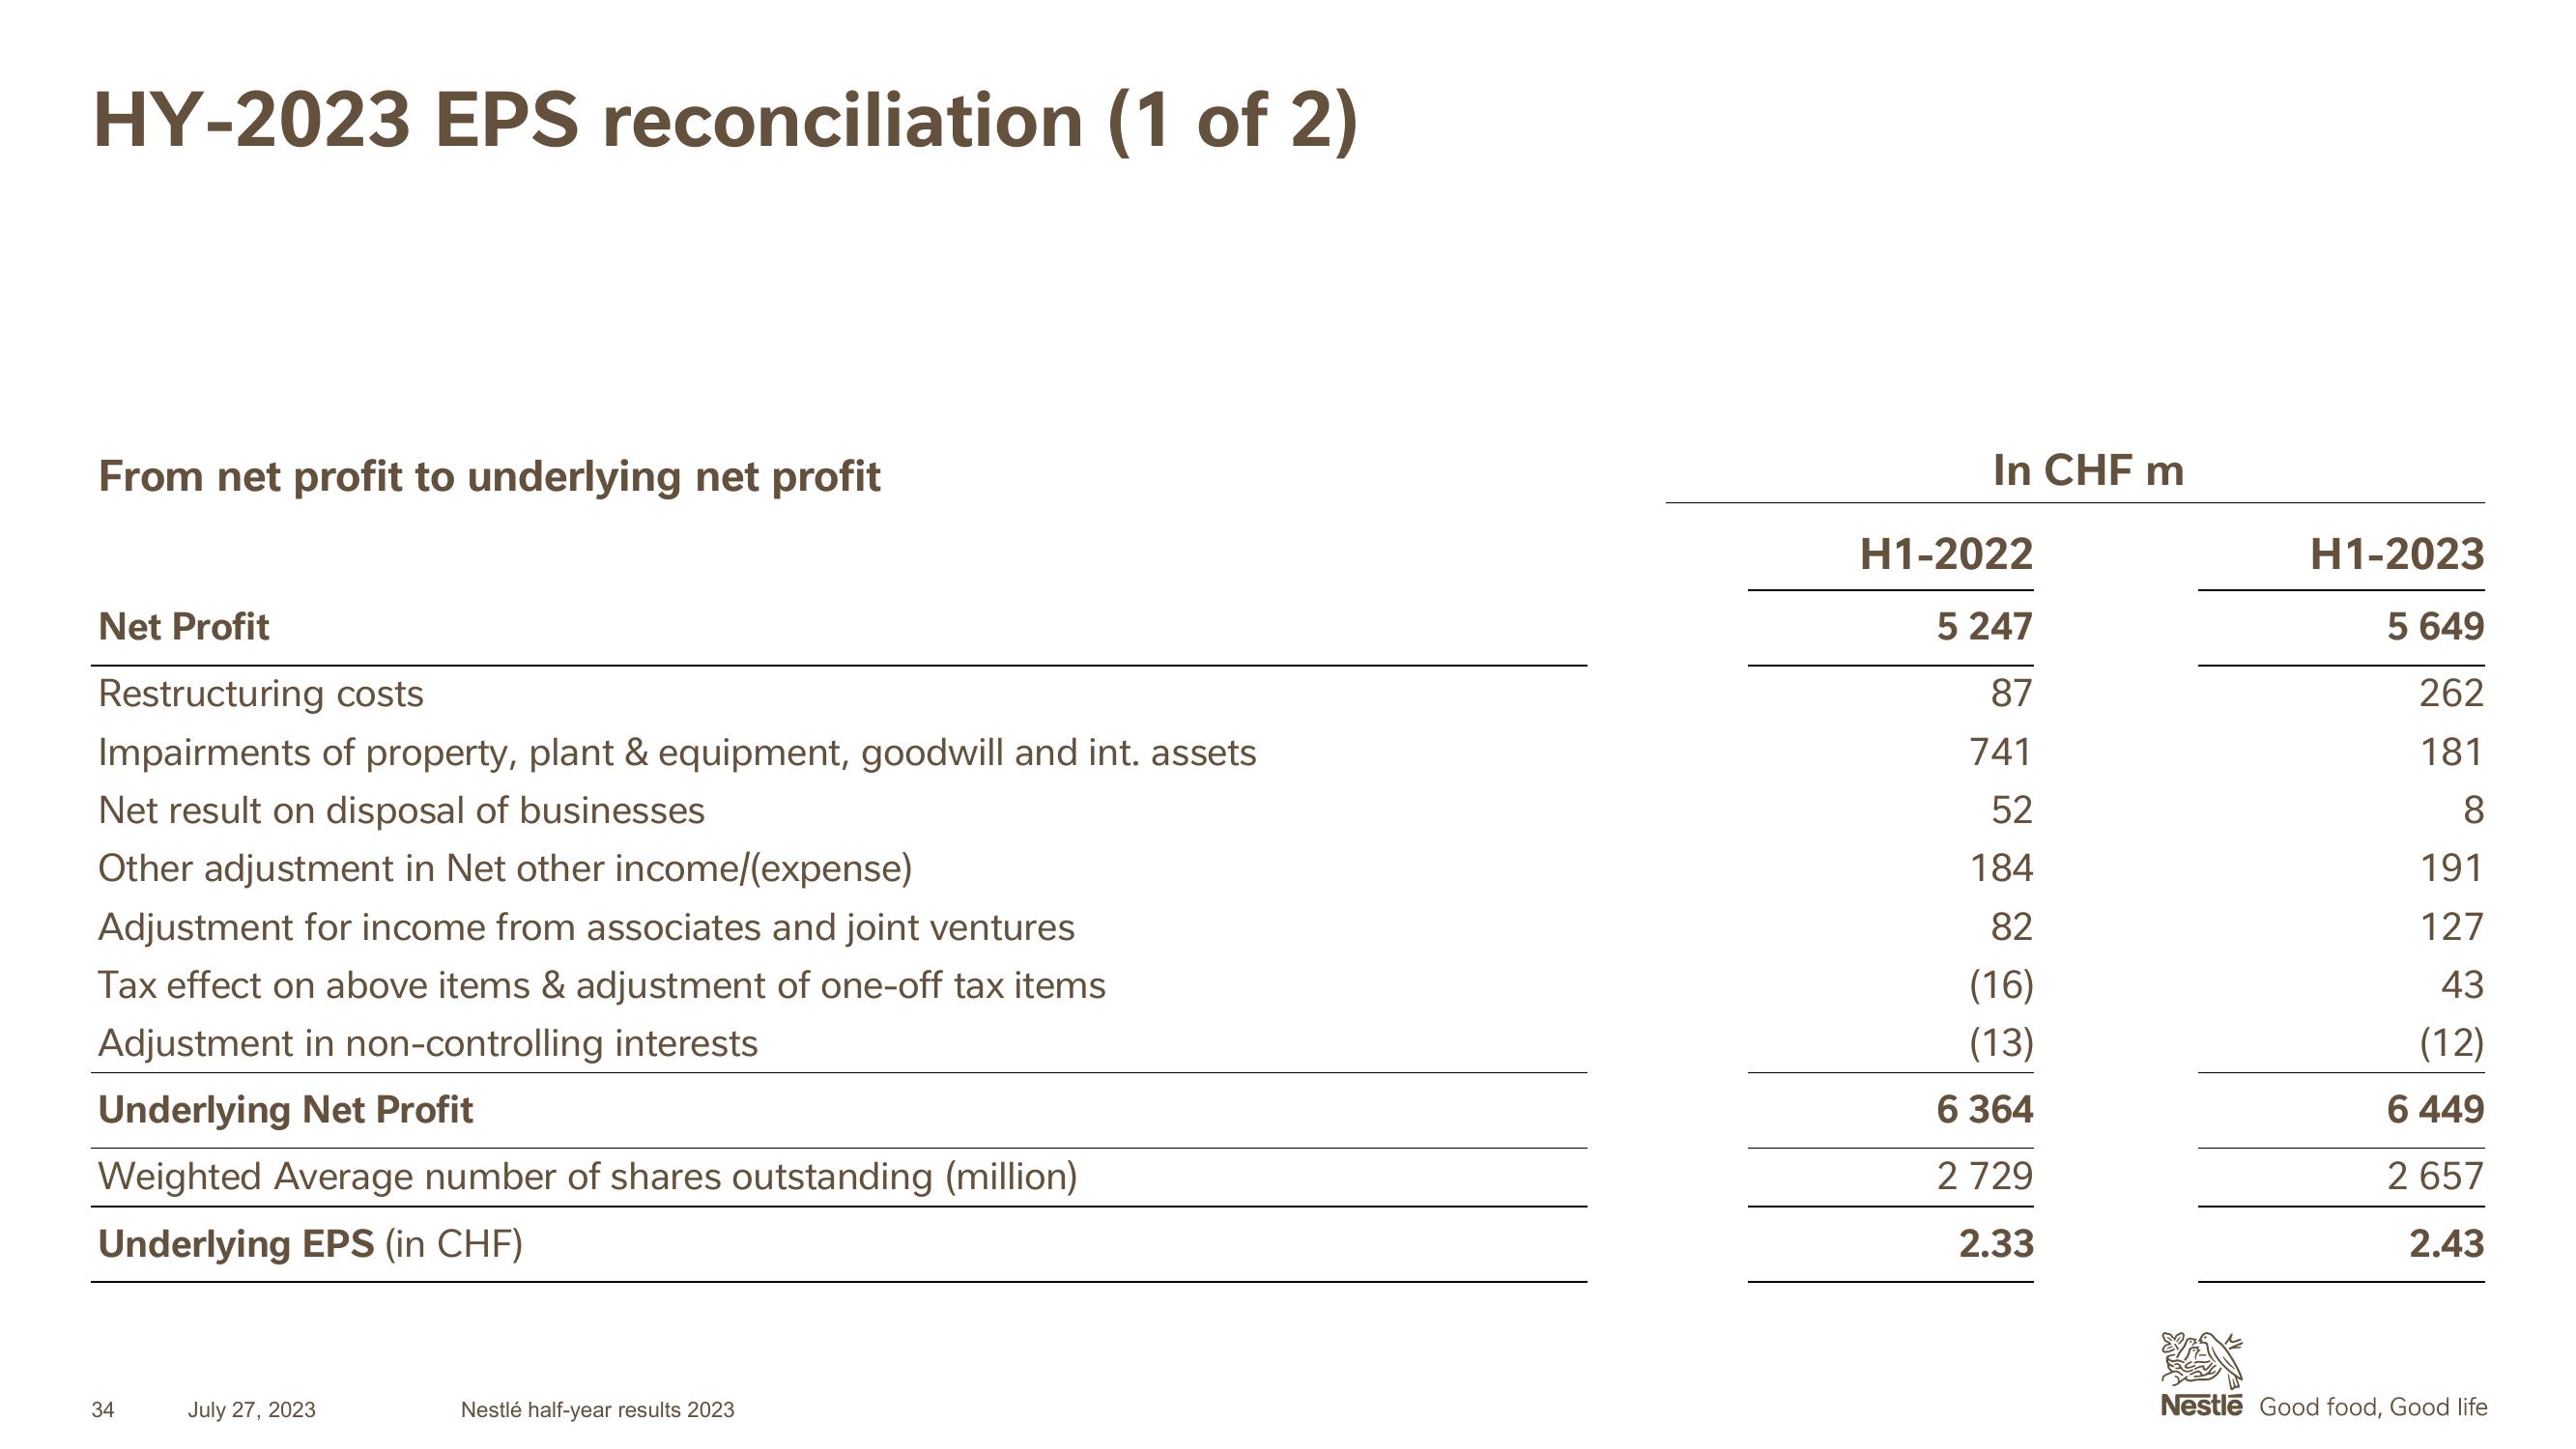
HY-2023 EPS reconciliation (1 of 2) From net profit to underlying net profit Net Profit Restructuring costs Impairments of property, plant & equipment, goodwill and int. assets Net result on disposal of businesses Other adjustment in Net other income/(expense) Adjustment for income from associates and joint ventures Tax effect on above items & adjustment of one-off tax items Adjustment in non-controlling interests Underlying Net Profit Weighted Average number of shares outstanding (million) Underlying EPS (in CHF) 34 July 27, 2023 Nestlé half-year results 2023 In CHF m H1-2022 5 247 87 741 52 184 82 (16) (13) 6 364 2 729 2.33 H1-2023 5 649 262 181 8 191 127 43 (12) 6 449 2 657 2.43 Nestle Good food, Good life
View entire presentation