FAT Brands Results Presentation Deck
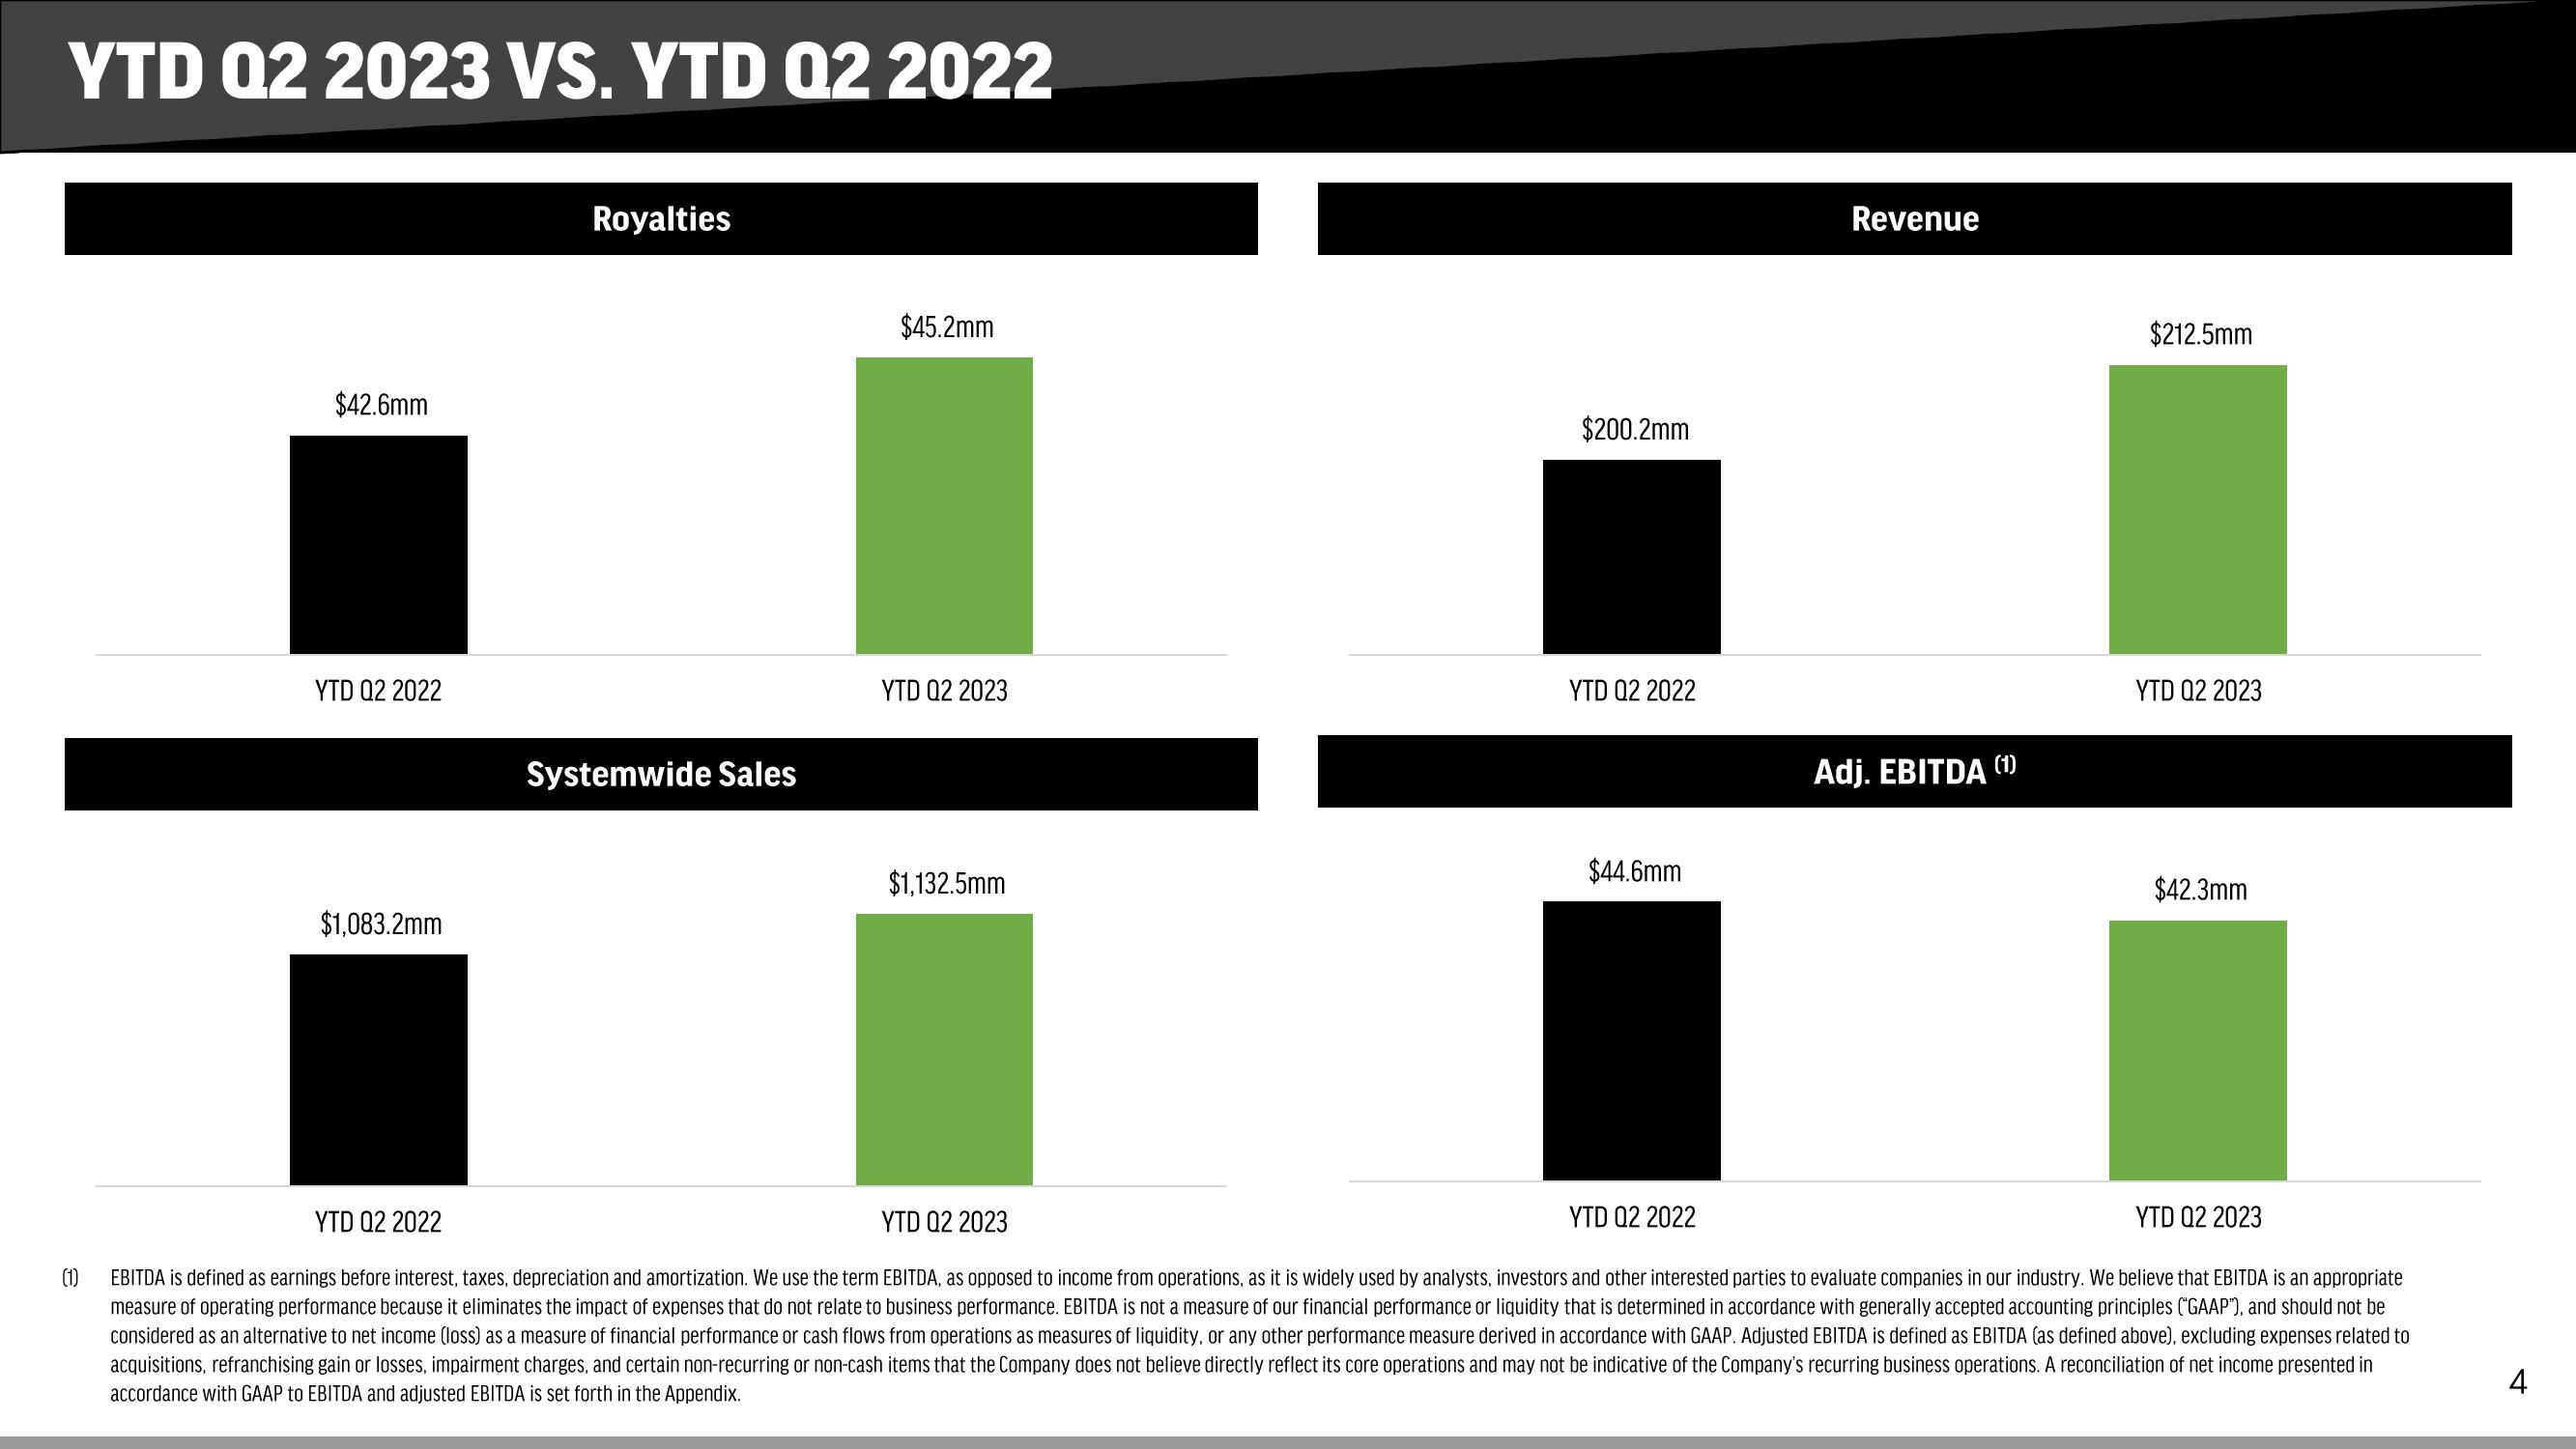
YTD 02 2023 VS. YTD Q2 2022
(1)
$42.6mm
YTD Q2 2022
$1,083.2mm
Royalties
Systemwide Sales
$45.2mm
YTD Q2 2023
$1,132.5mm
$200.2mm
YTD Q2 2022
$44.6mm
YTD Q2 2022
Revenue
Adj. EBITDA (1)
$212.5mm
YTD Q2 2023
$42.3mm
YTD Q2 2023
YTD Q2 2022
YTD Q2 2023
EBITDA is defined as earnings before interest, taxes, depreciation and amortization. We use the term EBITDA, as opposed to income from operations, as it is widely used by analysts, investors and other interested parties to evaluate companies in our industry. We believe that EBITDA is an appropriate
measure of operating performance because it eliminates the impact of expenses that do not relate to business performance. EBITDA is not a measure of our financial performance or liquidity that is determined in accordance with generally accepted accounting principles ("GAAP"), and should not be
considered as an alternative to net income (loss) as a measure of financial performance or cash flows from operations as measures of liquidity, or any other performance measure derived in accordance with GAAP. Adjusted EBITDA is defined as EBITDA (as defined above), excluding expenses related to
acquisitions, refranchising gain or losses, impairment charges, and certain non-recurring or non-cash items that the Company does not believe directly reflect its core operations and may not be indicative of the Company's recurring business operations. A reconciliation of net income presented in
accordance with GAAP to EBITDA and adjusted EBITDA is set forth in the Appendix.
4View entire presentation