Hilltop Holdings Results Presentation Deck
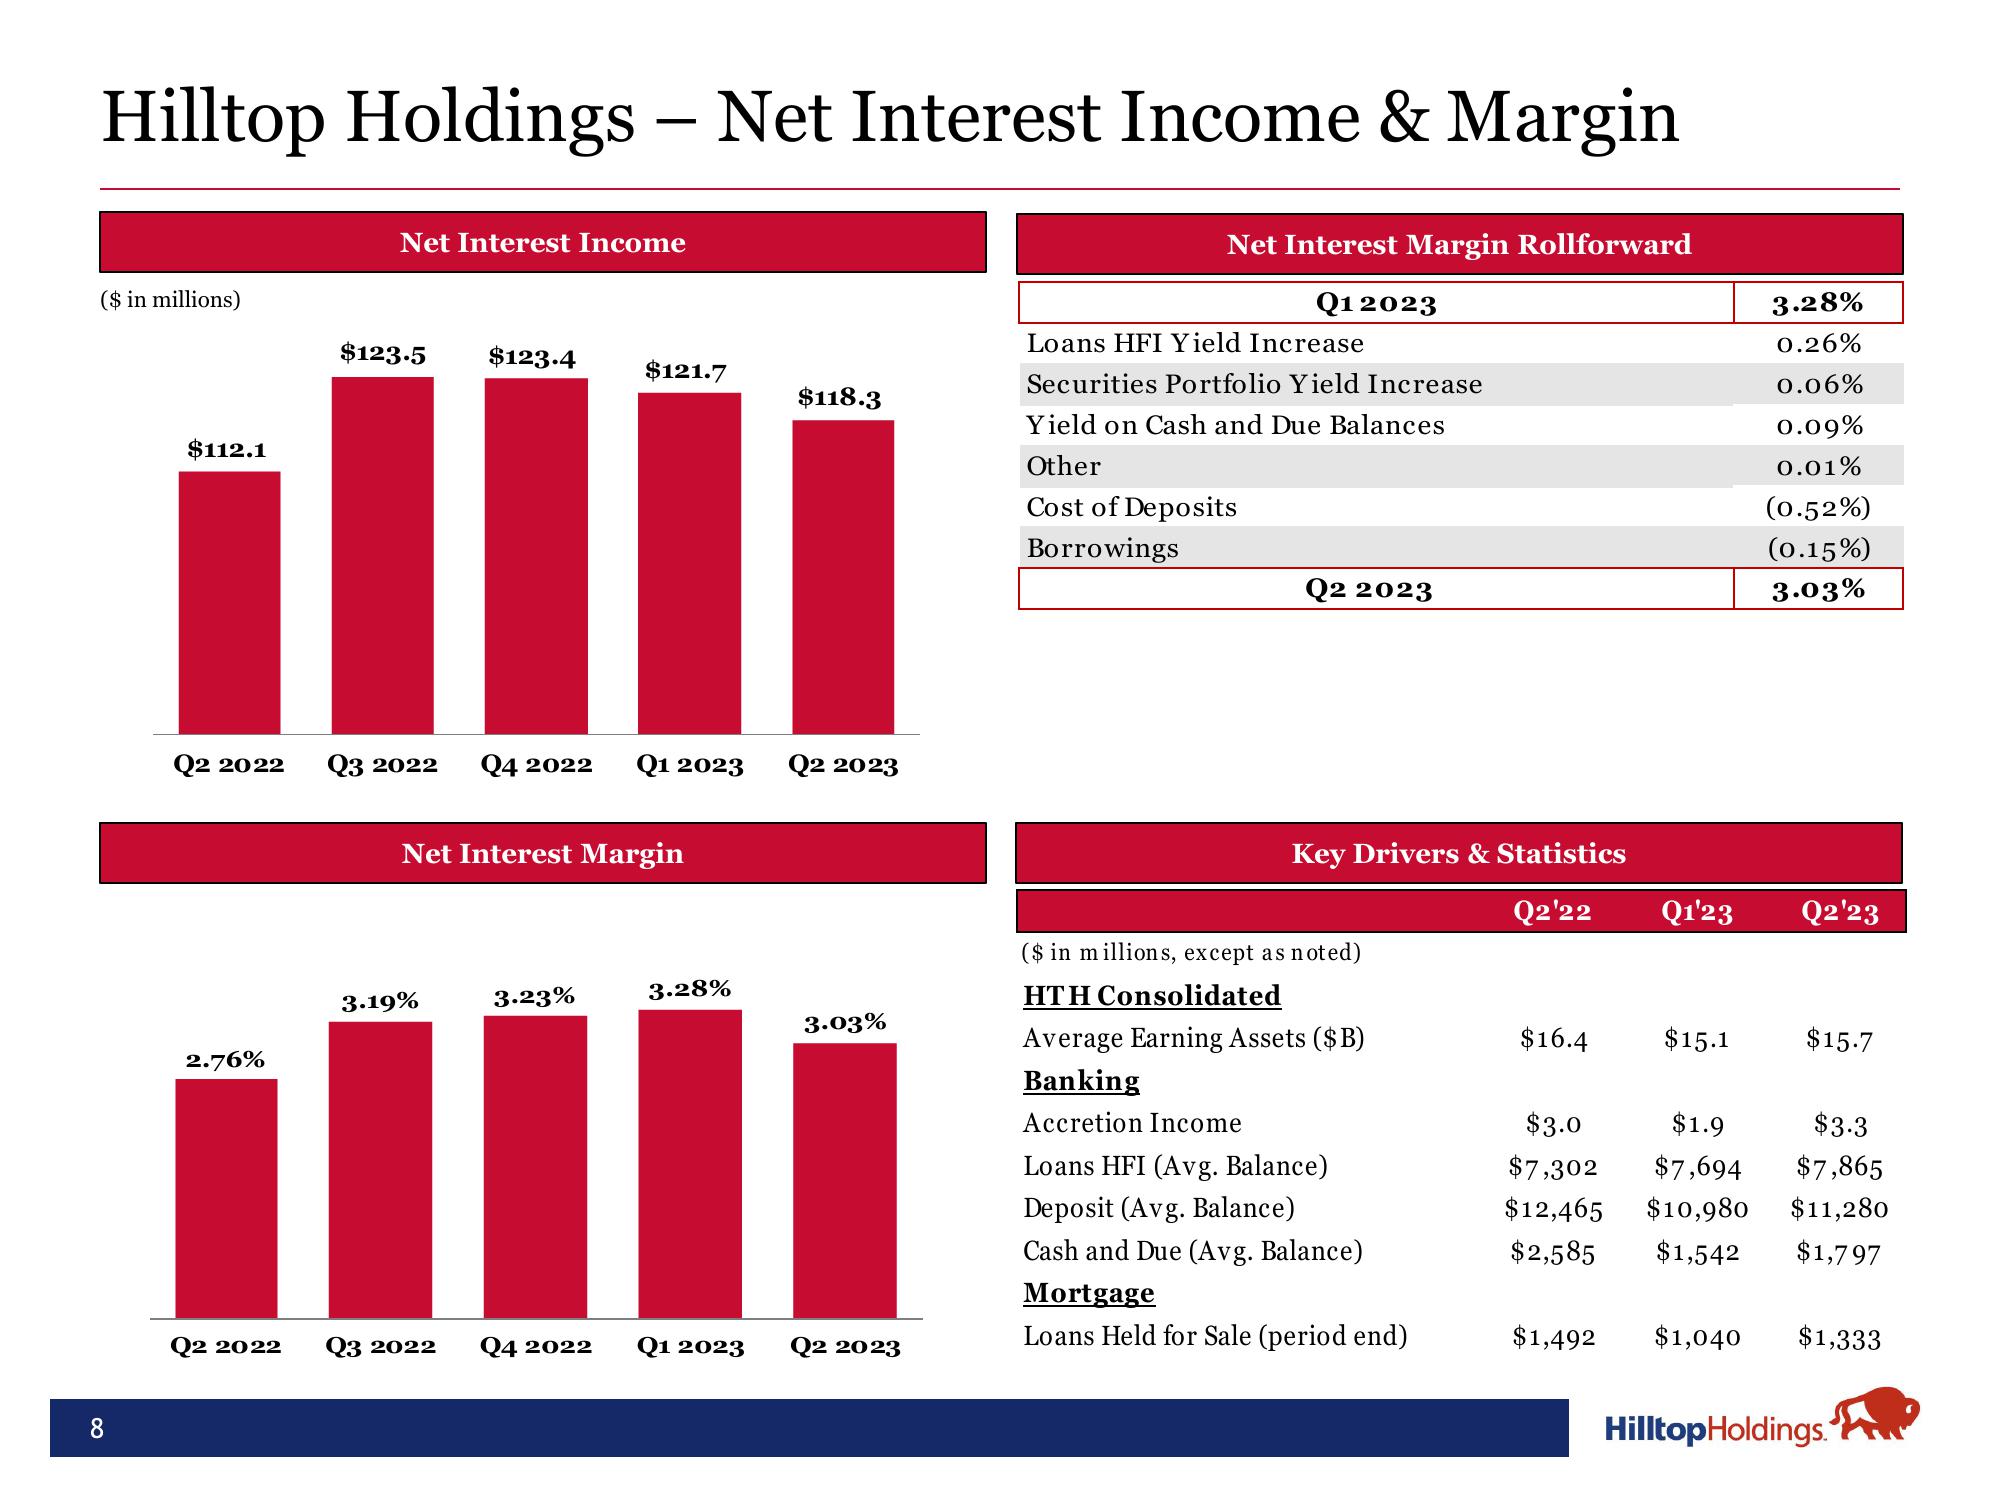
Hilltop Holdings - Net Interest Income & Margin
($ in millions)
8
$112.1
Q2 2022
2.76%
Net Interest Income
$123.5
$123.4
Q3 2022 Q4 2022 Q1 2023
3.19%
Net Interest Margin
$121.7
3.23%
Q2 2022 Q3 2022 Q4 2022
3.28%
$118.3
Q2 2023
3.03%
Q1 2023 Q2 2023
Net Interest Margin Rollforward
Q12023
Loans HFI Yield Increase
Securities Portfolio Yield Increase
Yield on Cash and Due Balances
Other
Cost of Deposits
Borrowings
Q2 2023
Key Drivers & Statistics
Q2'22
($ in millions, except as noted)
HTH Consolidated
Average Earning Assets ($B)
Banking
Accretion Income
Loans HFI (Avg. Balance)
Deposit (Avg. Balance)
Cash and Due (Avg. Balance)
Mortgage
Loans Held for Sale (period end)
$16.4
Q1'23
$1,492
$15.1
$3.0
$1.9
$7,302 $7,694
$12,465 $10,980
$2,585 $1,542
$1,040
3.28%
0.26%
0.06%
0.09%
0.01%
(0.52%)
(0.15%)
3.03%
Q2'23
$15.7
$3.3
$7,865
$11,280
$1,797
$1,333
Hilltop Holdings.View entire presentation