Silicon Valley Bank Results Presentation Deck
2021 Outlook
Outlook considerations
The innovation economy continues to thrive as COVID-19 has highlighted the importance of technology and healthcare
• Robust liquidity in our markets, supported by strong PE/VC fundraising and dry powder, providing fuel for long-term growth
COVID-19 vaccines position the broader economy for an eventual recovery, but vaccine delays, accelerated spread, mutations and
continued shutdowns present near-term uncertainties
●
●
Expect strong average balance sheet growth, stable charge-offs and continued investment in 2021
• Outlook excludes impact of changes in Fed Funds or LIBOR rates, SBA PPP 2.0, Boston Private acquisition (pending¹) and potential
corporate tax rate or other changes under the new U.S. government administration
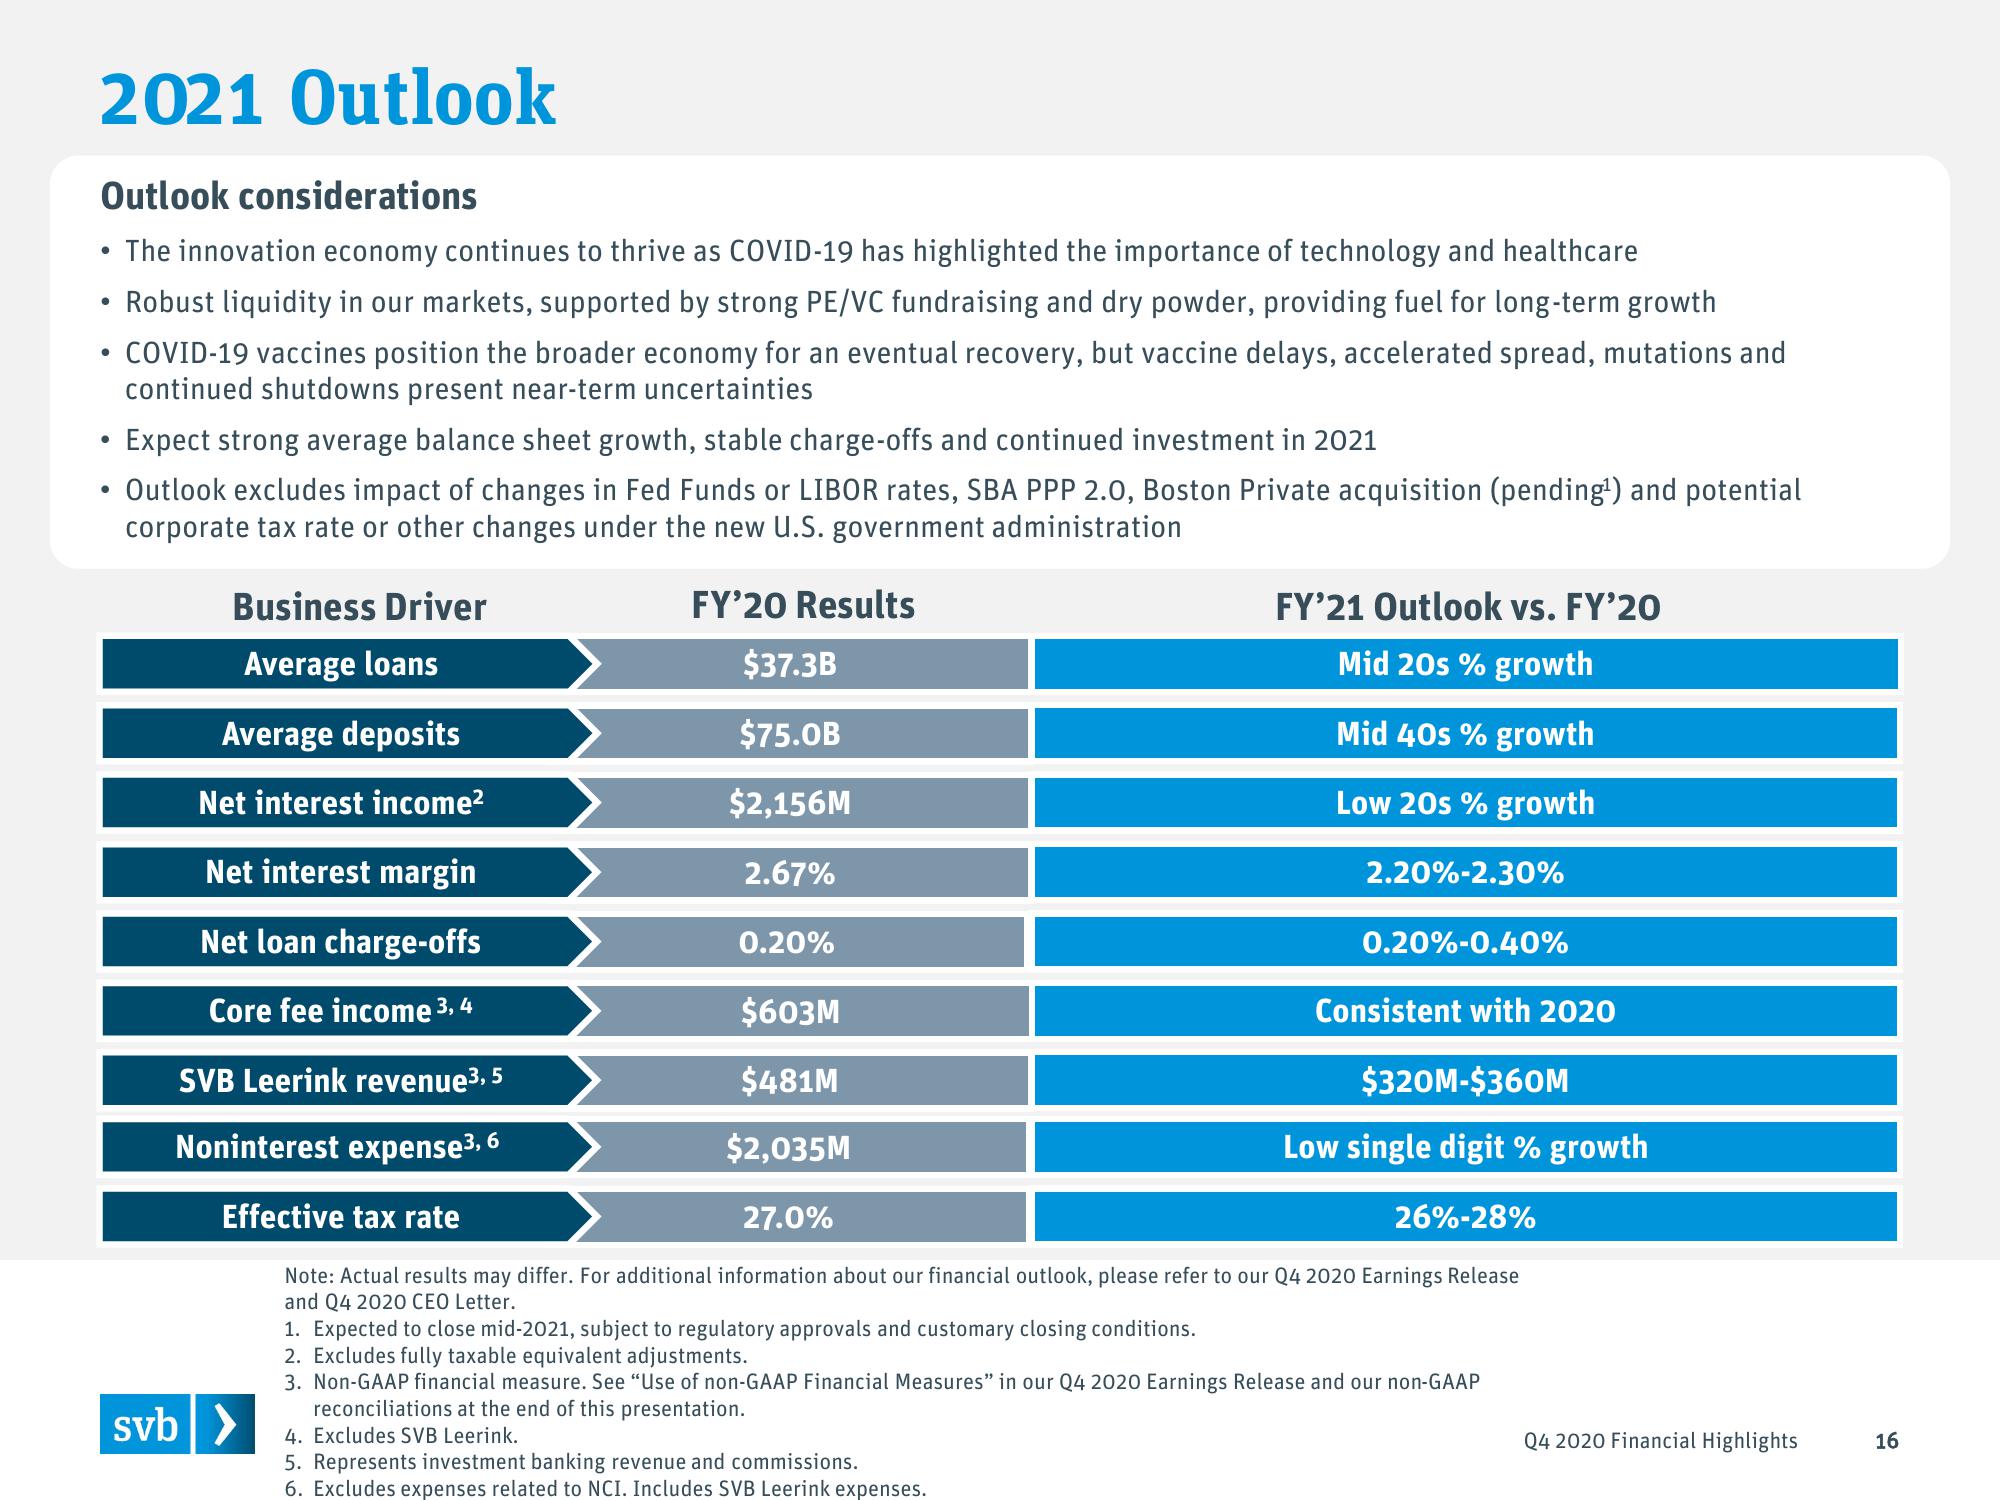
FY'20 Results
$37.3B
$75.0B
$2,156M
2.67%
●
Business Driver
Average loans
Average deposits
Net interest income²
Net interest margin
Net loan charge-offs
Core fee income 3, 4
SVB Leerink revenue ³, 5
Noninterest expense³, 6
0.20%
svb >
FY'21 Outlook vs. FY'20
Mid 20s % growth
Mid 40s % growth
Low 20s % growth
2.20%-2.30%
0.20%-0.40%
$603M
$481M
$320M-$360M
$2,035M
Low single digit % growth
Effective tax rate
27.0%
26%-28%
Note: Actual results may differ. For additional information about our financial outlook, please refer to our Q4 2020 Earnings Release
and Q4 2020 CEO Letter.
Consistent with 2020
1. Expected to close mid-2021, subject to regulatory approvals and customary closing conditions.
2. Excludes fully taxable equivalent adjustments.
3. Non-GAAP financial measure. See "Use of non-GAAP Financial Measures" in our Q4 2020 Earnings Release and our non-GAAP
reconciliations at the end of this presentation.
4. Excludes SVB Leerink.
5. Represents investment banking revenue and commissions.
6. Excludes expenses related to NCI. Includes SVB Leerink expenses.
Q4 2020 Financial Highlights
16View entire presentation