Freyr SPAC Presentation Deck
1)
2)
FREYR at a Glance: Addressing the Life Cycle Carbon Footprint of Battery Cells
Delivering clean, low-cost battery cells from an ethically and
sustainably-sourced supply chain
po
Cell production is the segment with the highest revenue share
within the battery value chain
Strategic partnering of next-generation semi-solid battery cell
technology is expected to materially reduce costs
Leveraging Norway's skilled workforce and abundant, low-cost
renewable energy sources to target net zero carbon
Planning for ~43 GWh of capacity by 2025 to position as one
of Europe's largest cell suppliers, displacing dependency on
Asian imports
Projected 2025e Revenue and EBITDA of $2.9 billion and
$703 million, respectively ¹)
See Slide 33 for key assumptions and additional details
Global average based on stated sources, FREYR data based on company projections
FREYR
Clean battery solutions
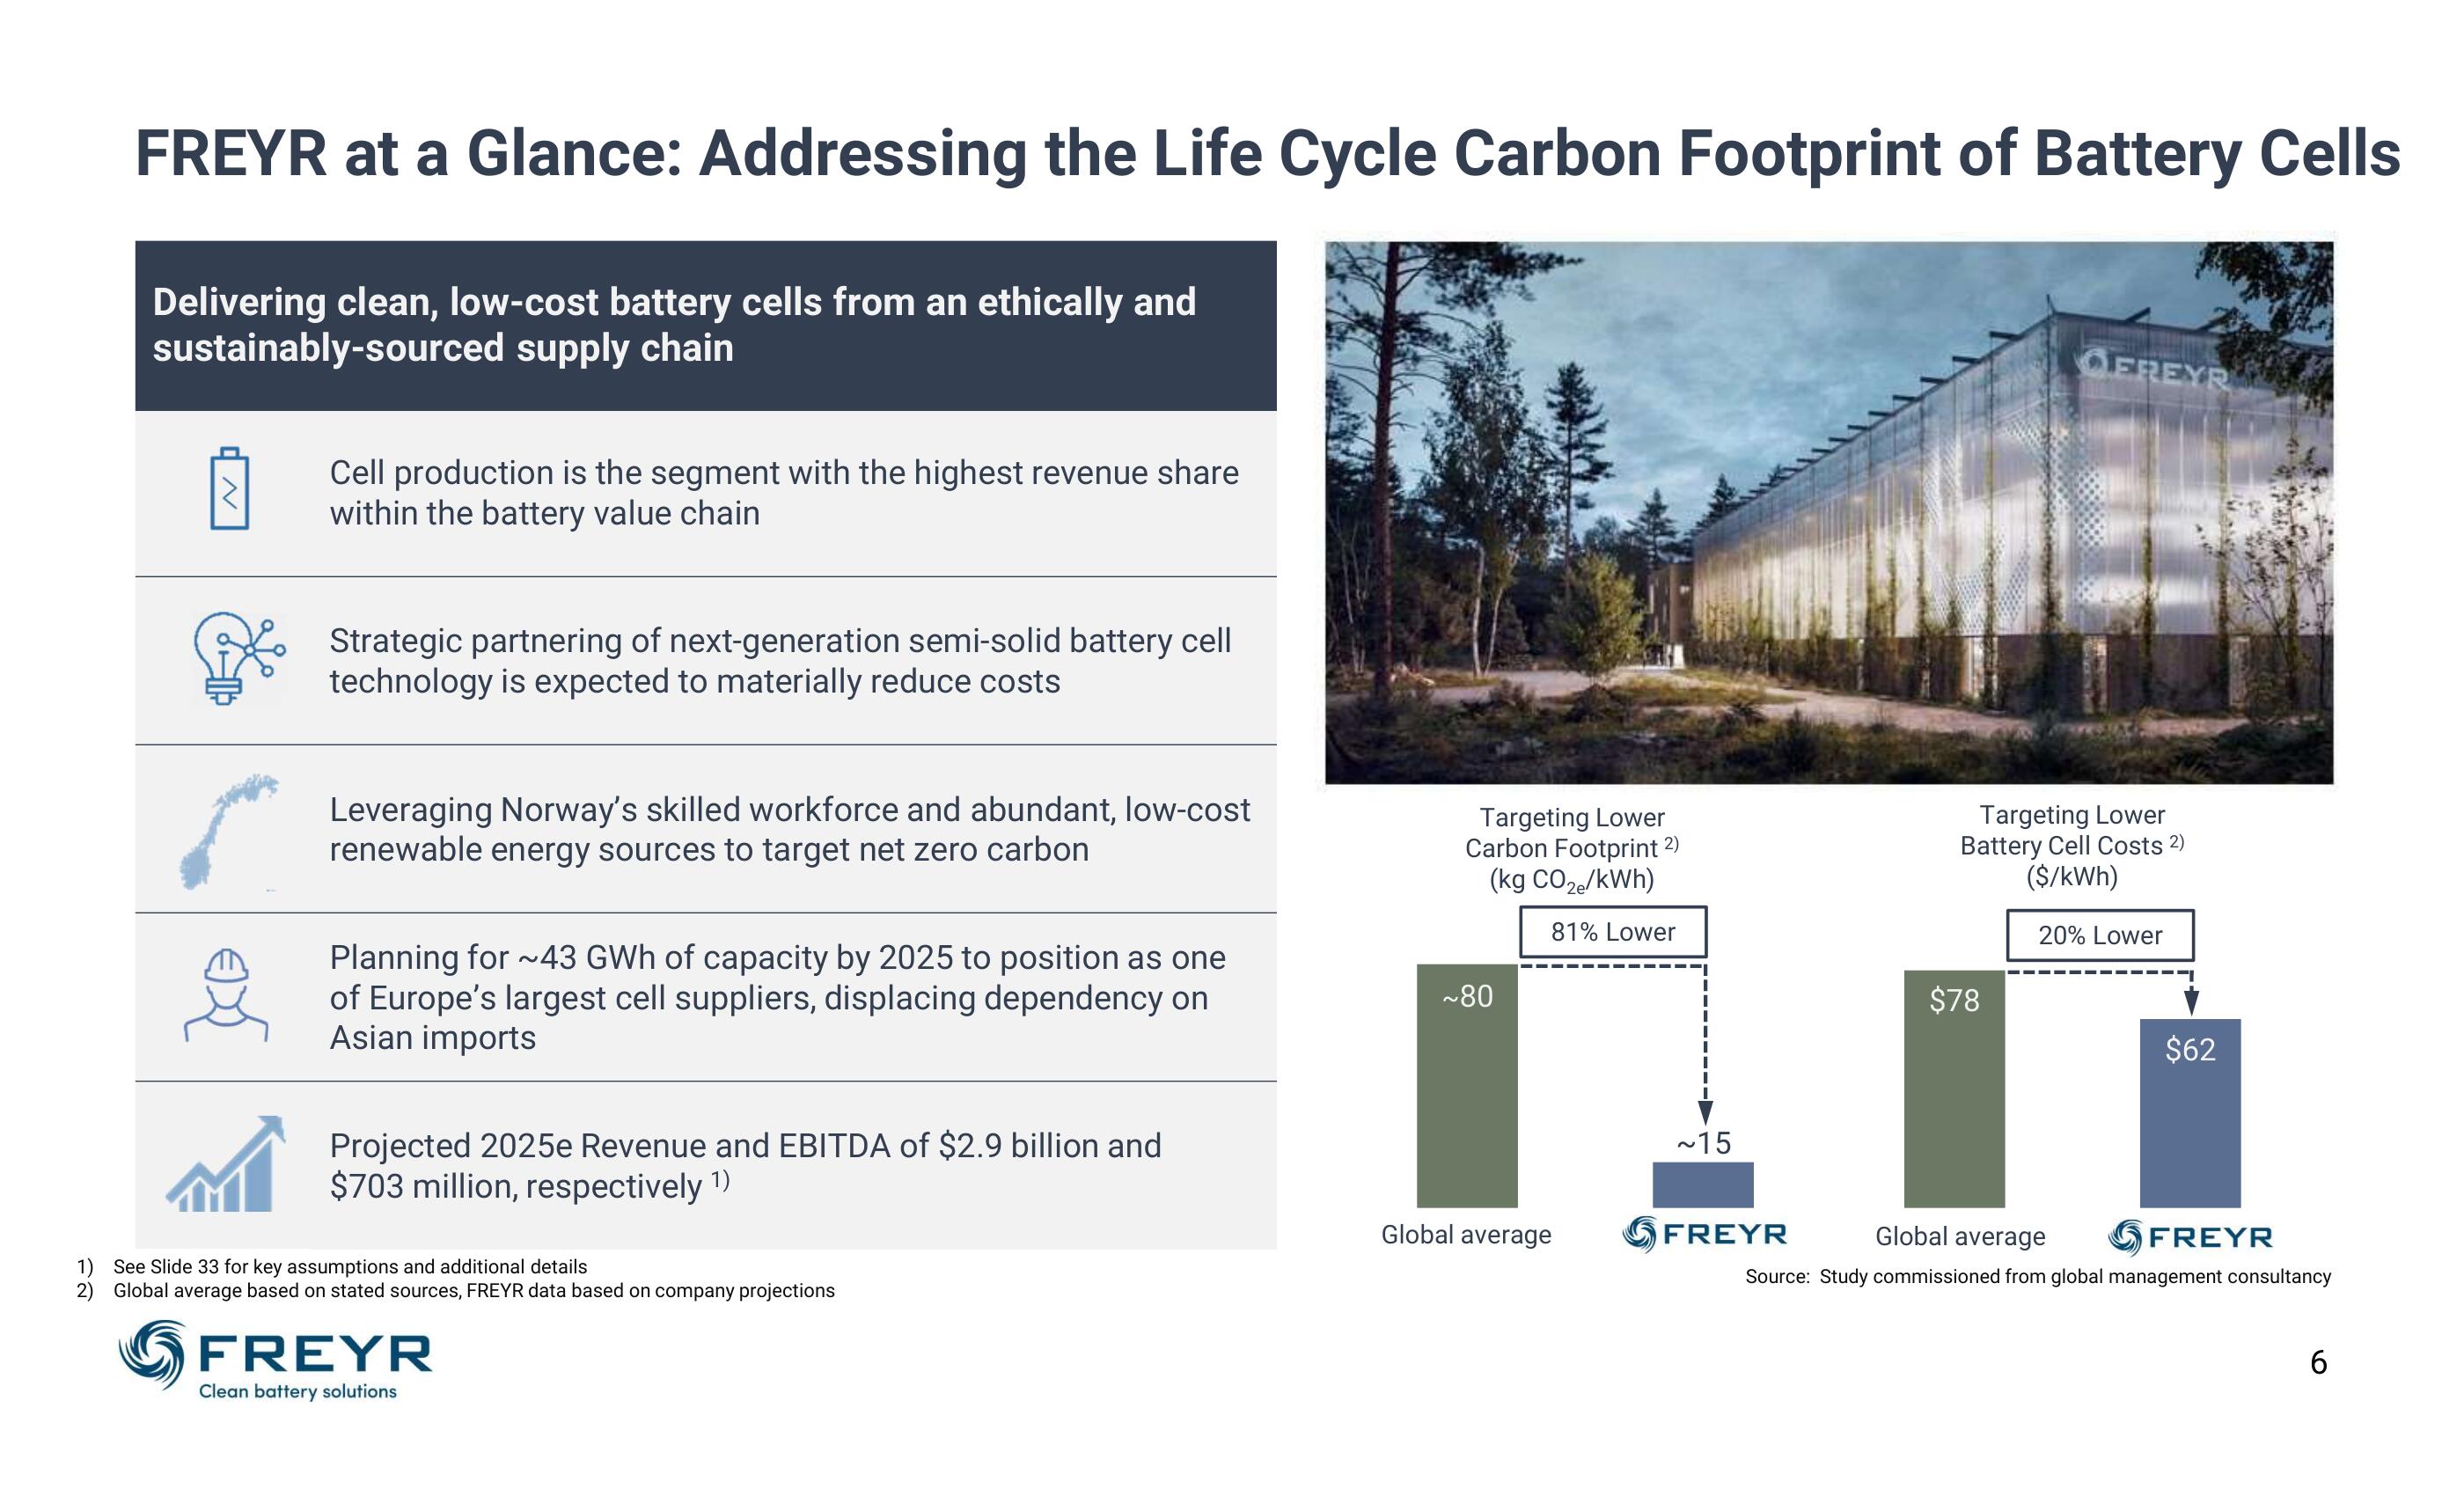
Targeting Lower
Carbon Footprint 2)
(kg CO ₂e/kWh)
~80
81% Lower
Global average
I
I
1
~15
FREYR
EREYR
Targeting Lower
Battery Cell Costs 2)
($/kWh)
$78
20% Lower
$62
Global average
FREYR
Source: Study commissioned from global management consultancy
6View entire presentation