J.P.Morgan Investment Banking
APPENDIX
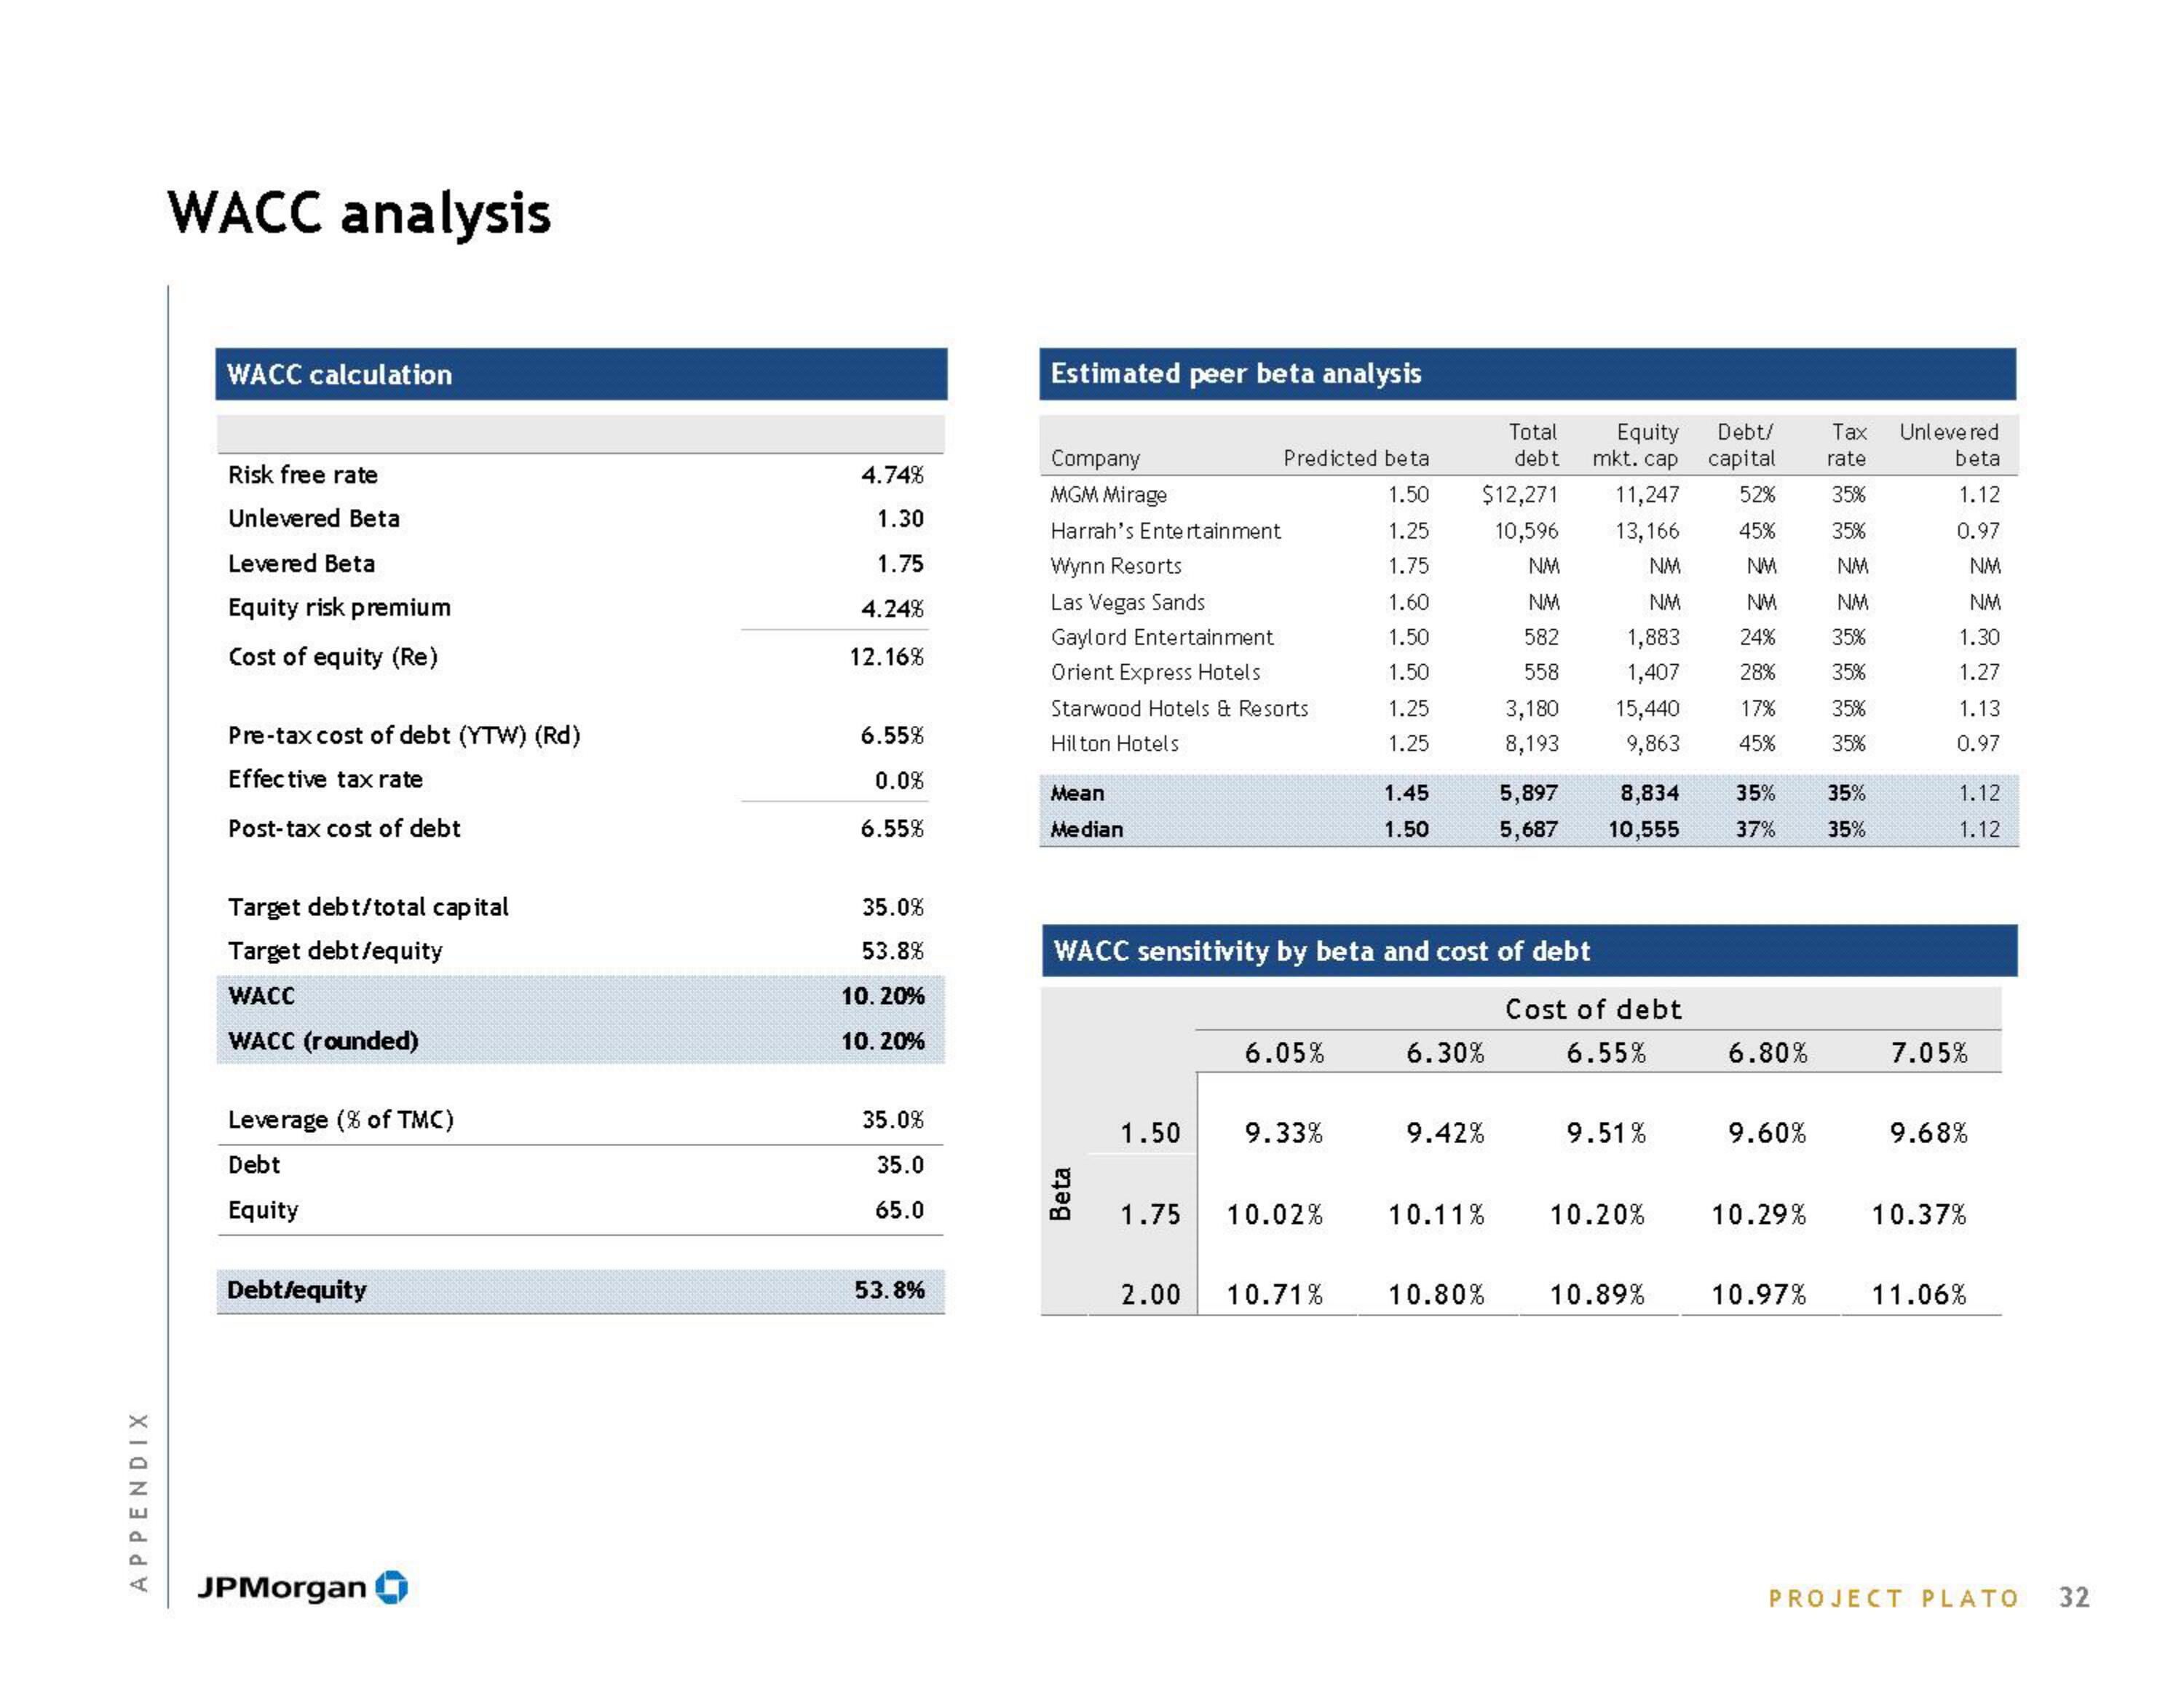
WACC analysis
WACC calculation
Risk free rate
Unlevered Beta
Levered Beta
Equity risk premium
Cost of equity (Re)
Pre-tax cost of debt (YTW) (Rd)
Effective tax rate
Post-tax cost of debt
Target debt/total capital
Target debt /equity
WACC
WACC (rounded)
Leverage (8 of TMC)
Debt
Equity
Debt/equity
JPMorgan
4.74%
1.30
1.75
4.24%
12.16%
6.55%
0.0%
6.55%
35.0%
53.8%
10. 20%
10. 20%
35.0%
35.0
65.0
53.8%
Estimated peer beta analysis
Company
MGM Mirage
Harrah's Entertainment
Wynn Resorts
Las Vegas Sands
Gaylord Entertainment
Orient Express Hotels
Starwood Hotels & Resorts
Hilton Hotels
Mean
Median
Beta
1.50
Predicted beta
1.50
1.25
1.75
1.60
1.50
1.50
1.25
1.25
1.75
2.00
WACC sensitivity by beta and cost of debt
6.05%
9.33%
10.02%
1.45
1.50
10.71%
Total
debt
$12,271
10,596
NM
NM
582
558
3,180
8,193
6.30%
9.42%
10.11%
5,897
5,687
10.80%
Equity
mkt. cap
11,247
13,166
NM
NM
1,883
1,407
15,440
9,863
8,834
10,555
Cost of debt
6.55%
9.51%
10.20%
10.89%
Debt/
capital
52%
45%
NM
NM
24%
28%
17%
45%
35%
37%
6.80%
9.60%
10.29%
10.97%
Tax
rate
35%
35%
NM
NM
35%
35%
35%
35%
35%
35%
Unlevered
beta
1.12
0.97
NM
NM
1.30
1.27
1.13
0.97
1.12
1.12
7.05%
9.68%
10.37%
11.06%
PROJECT PLATO
32View entire presentation