OppFi Results Presentation Deck
7
Quarterly Key Performance Indicators
Unaudited Quarter Ended,
($ in millions), except Total
Marketing Cost
Net Originations¹
Ending Receivables²
% of Originations by Bank
Partners
Net Charge-Offs as % of
Avg. Receivables3
Average Yield4
Automatic Approval Rate5
Total Marketing Cost per
Funded Loan
Total Marketing Cost per
New Funded Loan7
3/31/2021
$100
$245
76%
30%
130%
41%
$56
$266
3/31/2022
$163
$338
95%
56%
120%
61%
$76
$221
Key Highlights
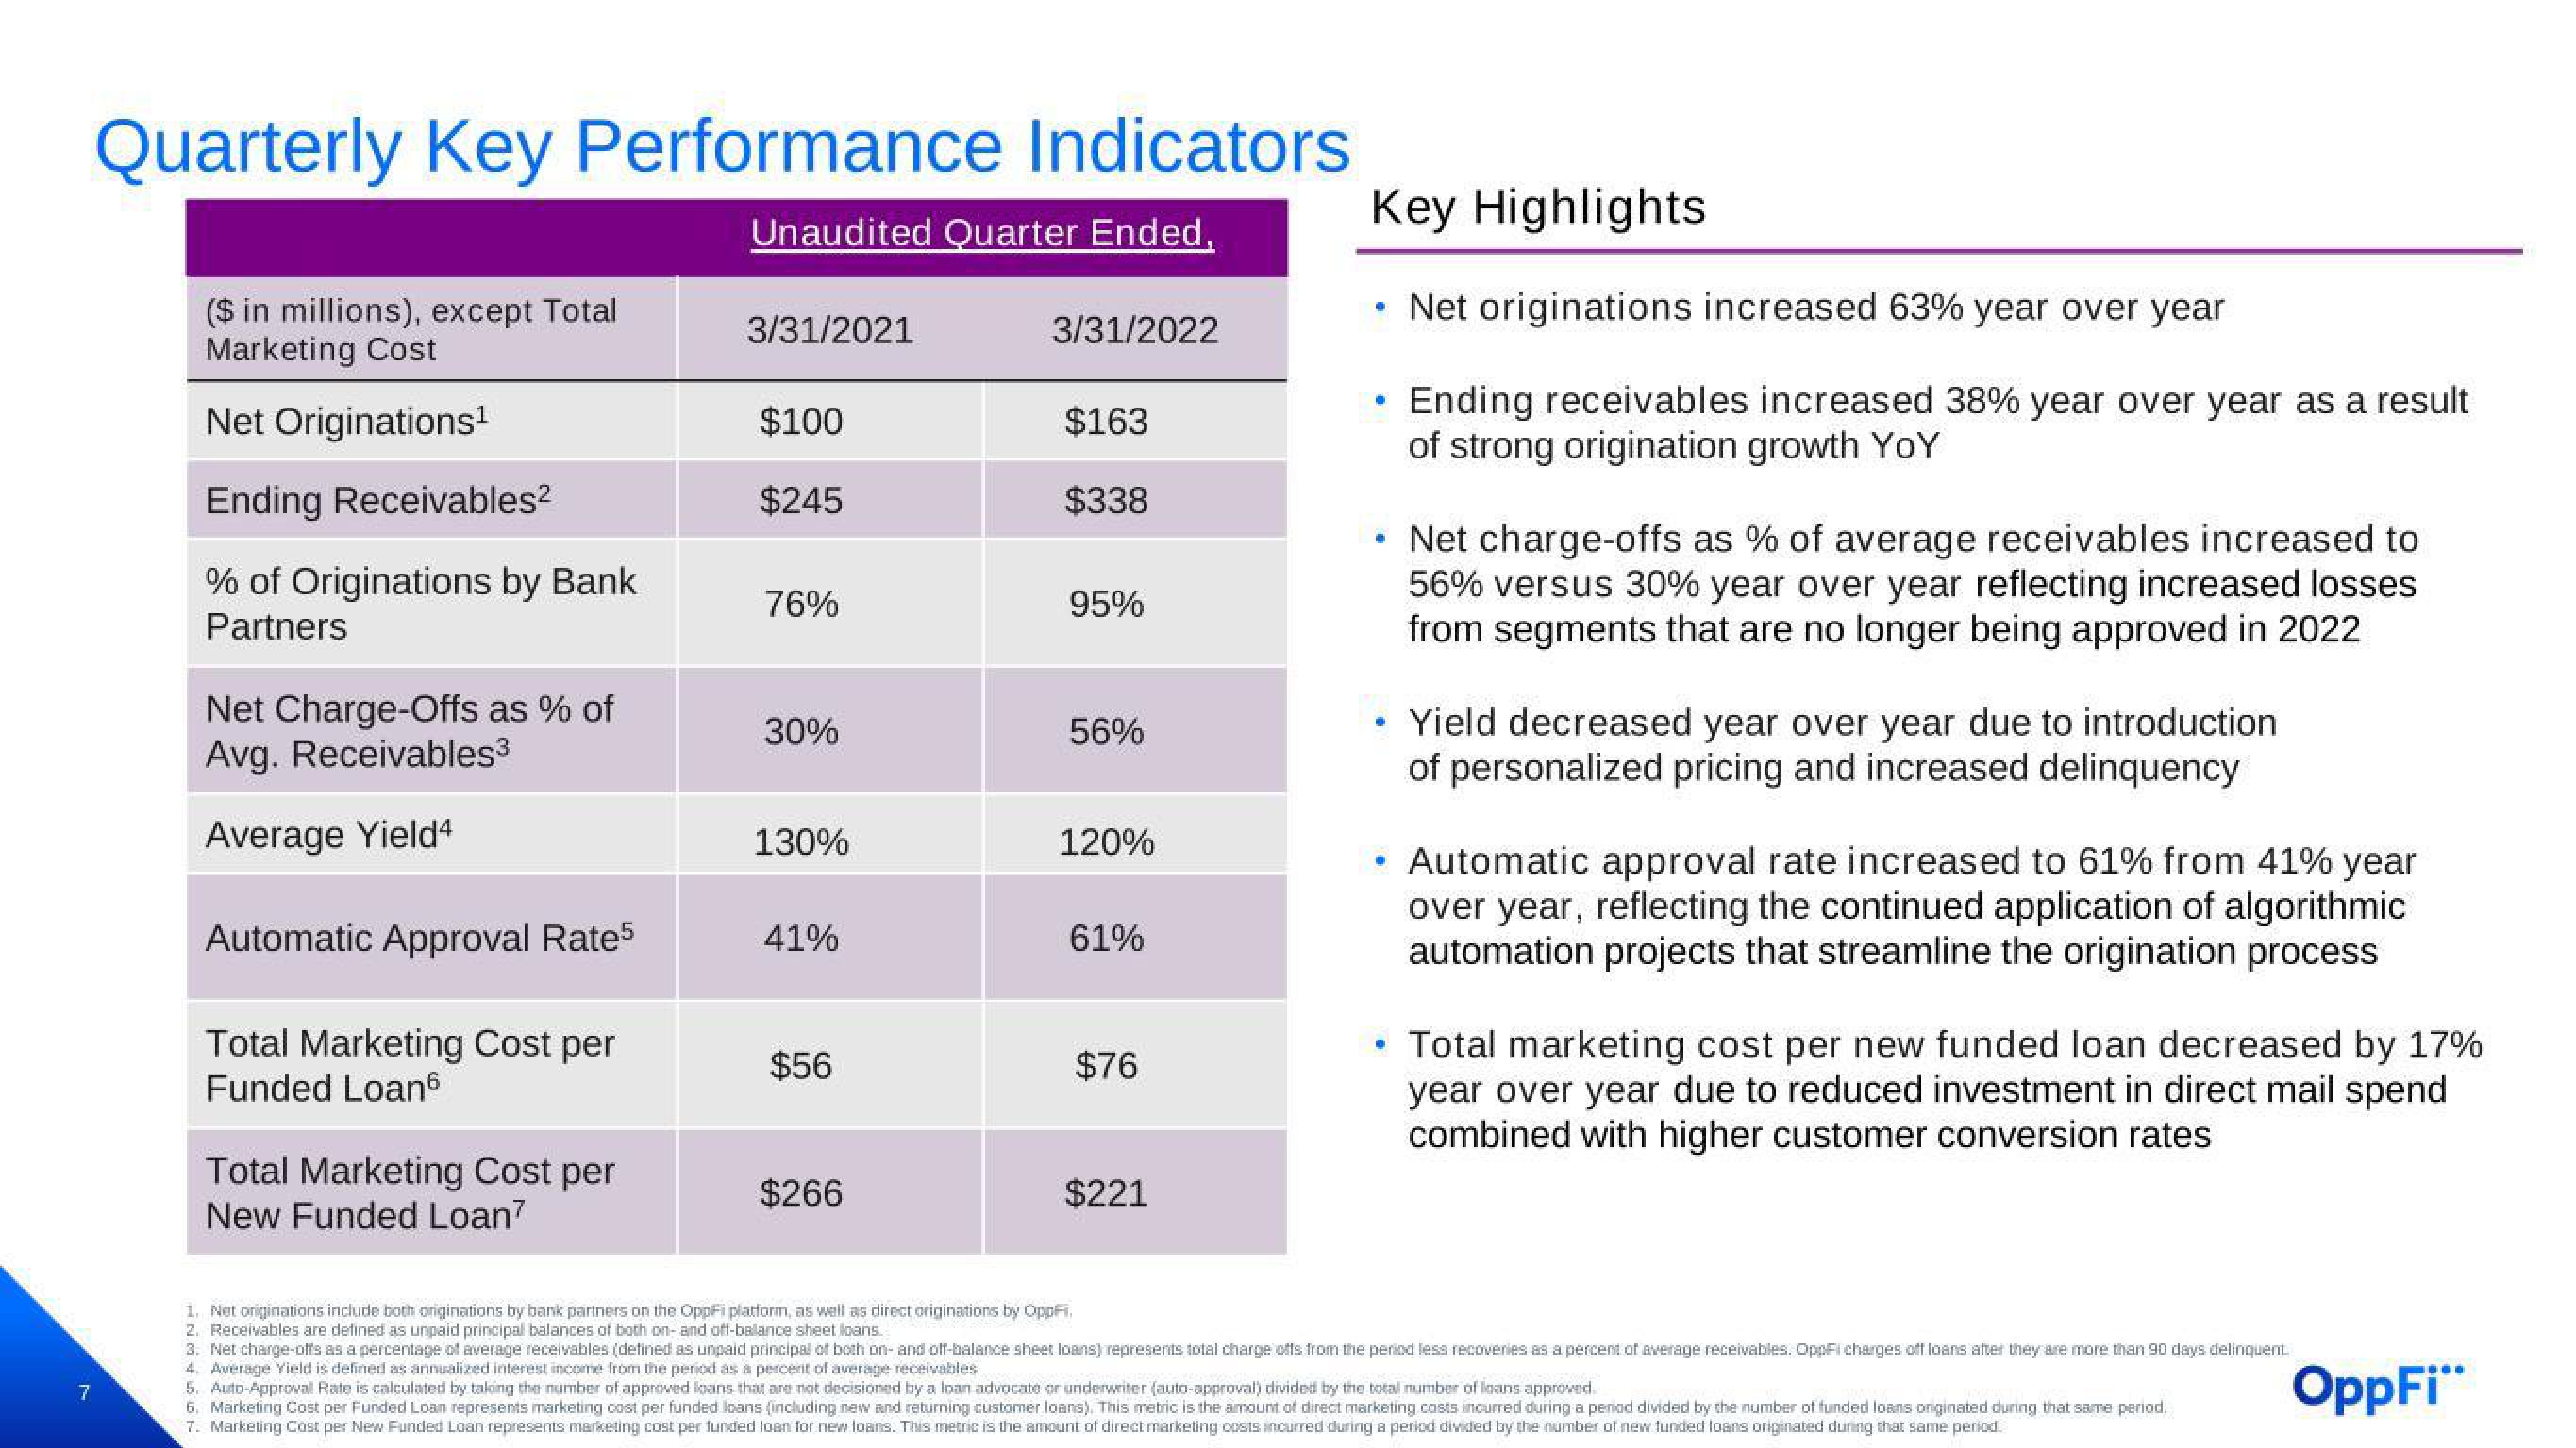
Net originations increased 63% year over year
•
Ending receivables increased 38% year over year as a result
of strong origination growth YoY
•
Net charge-offs as % of average receivables increased to
56% versus 30% year over year reflecting increased losses
from segments that are no longer being approved in 2022
• Yield decreased year over year due to introduction
of personalized pricing and increased delinquency
Automatic approval rate increased to 61% from 41% year
over year, reflecting the continued application of algorithmic
automation projects that streamline the origination process
Total marketing cost per new funded loan decreased by 17%
year over year due to reduced investment in direct mail spend
combined with higher customer conversion rates
1. Net originations include both originations by bank pariners on the Oppfi platform, as well as direct originations by Oppfi,
2. Receivables are defined as unpaid principal balances of both on- and off-balance sheet loans.
3. Net charge-offs as a percentage of average receivables (defined as unpaid principal of both on- and off-balance sheet loans) represents total charge offs from the period less recoveries as a percent of average receivables. OppFi charges off loans after they are more than 90 days delinquent.
4. Average Yield is defined as annualized interest income from the period as a percent of average receivables
5. Auto-Approval Rate is calculated by taking the number of approved loans that are not decisioned by a loan advocate or underwriter (auto-approval) divided by the total number of loans approved.
6. Marketing Cost per Funded Loan represents marketing cost per funded loans (including new and returning customer loans). This metric is the amount of direct marketing costs incurred during a penad divided by the number of funded loans originated during that same period.
7. Marketing Cost per New Funded Loan represents marketing cost per funded loan for new loans. This metric is the amount of direct marketing costs incurred during a period divided by the number of new funded loans originated during that same period.
OppFi"View entire presentation