Crocs Investor Presentation Deck
NON-GAAP RECONCILIATION (cont'd)
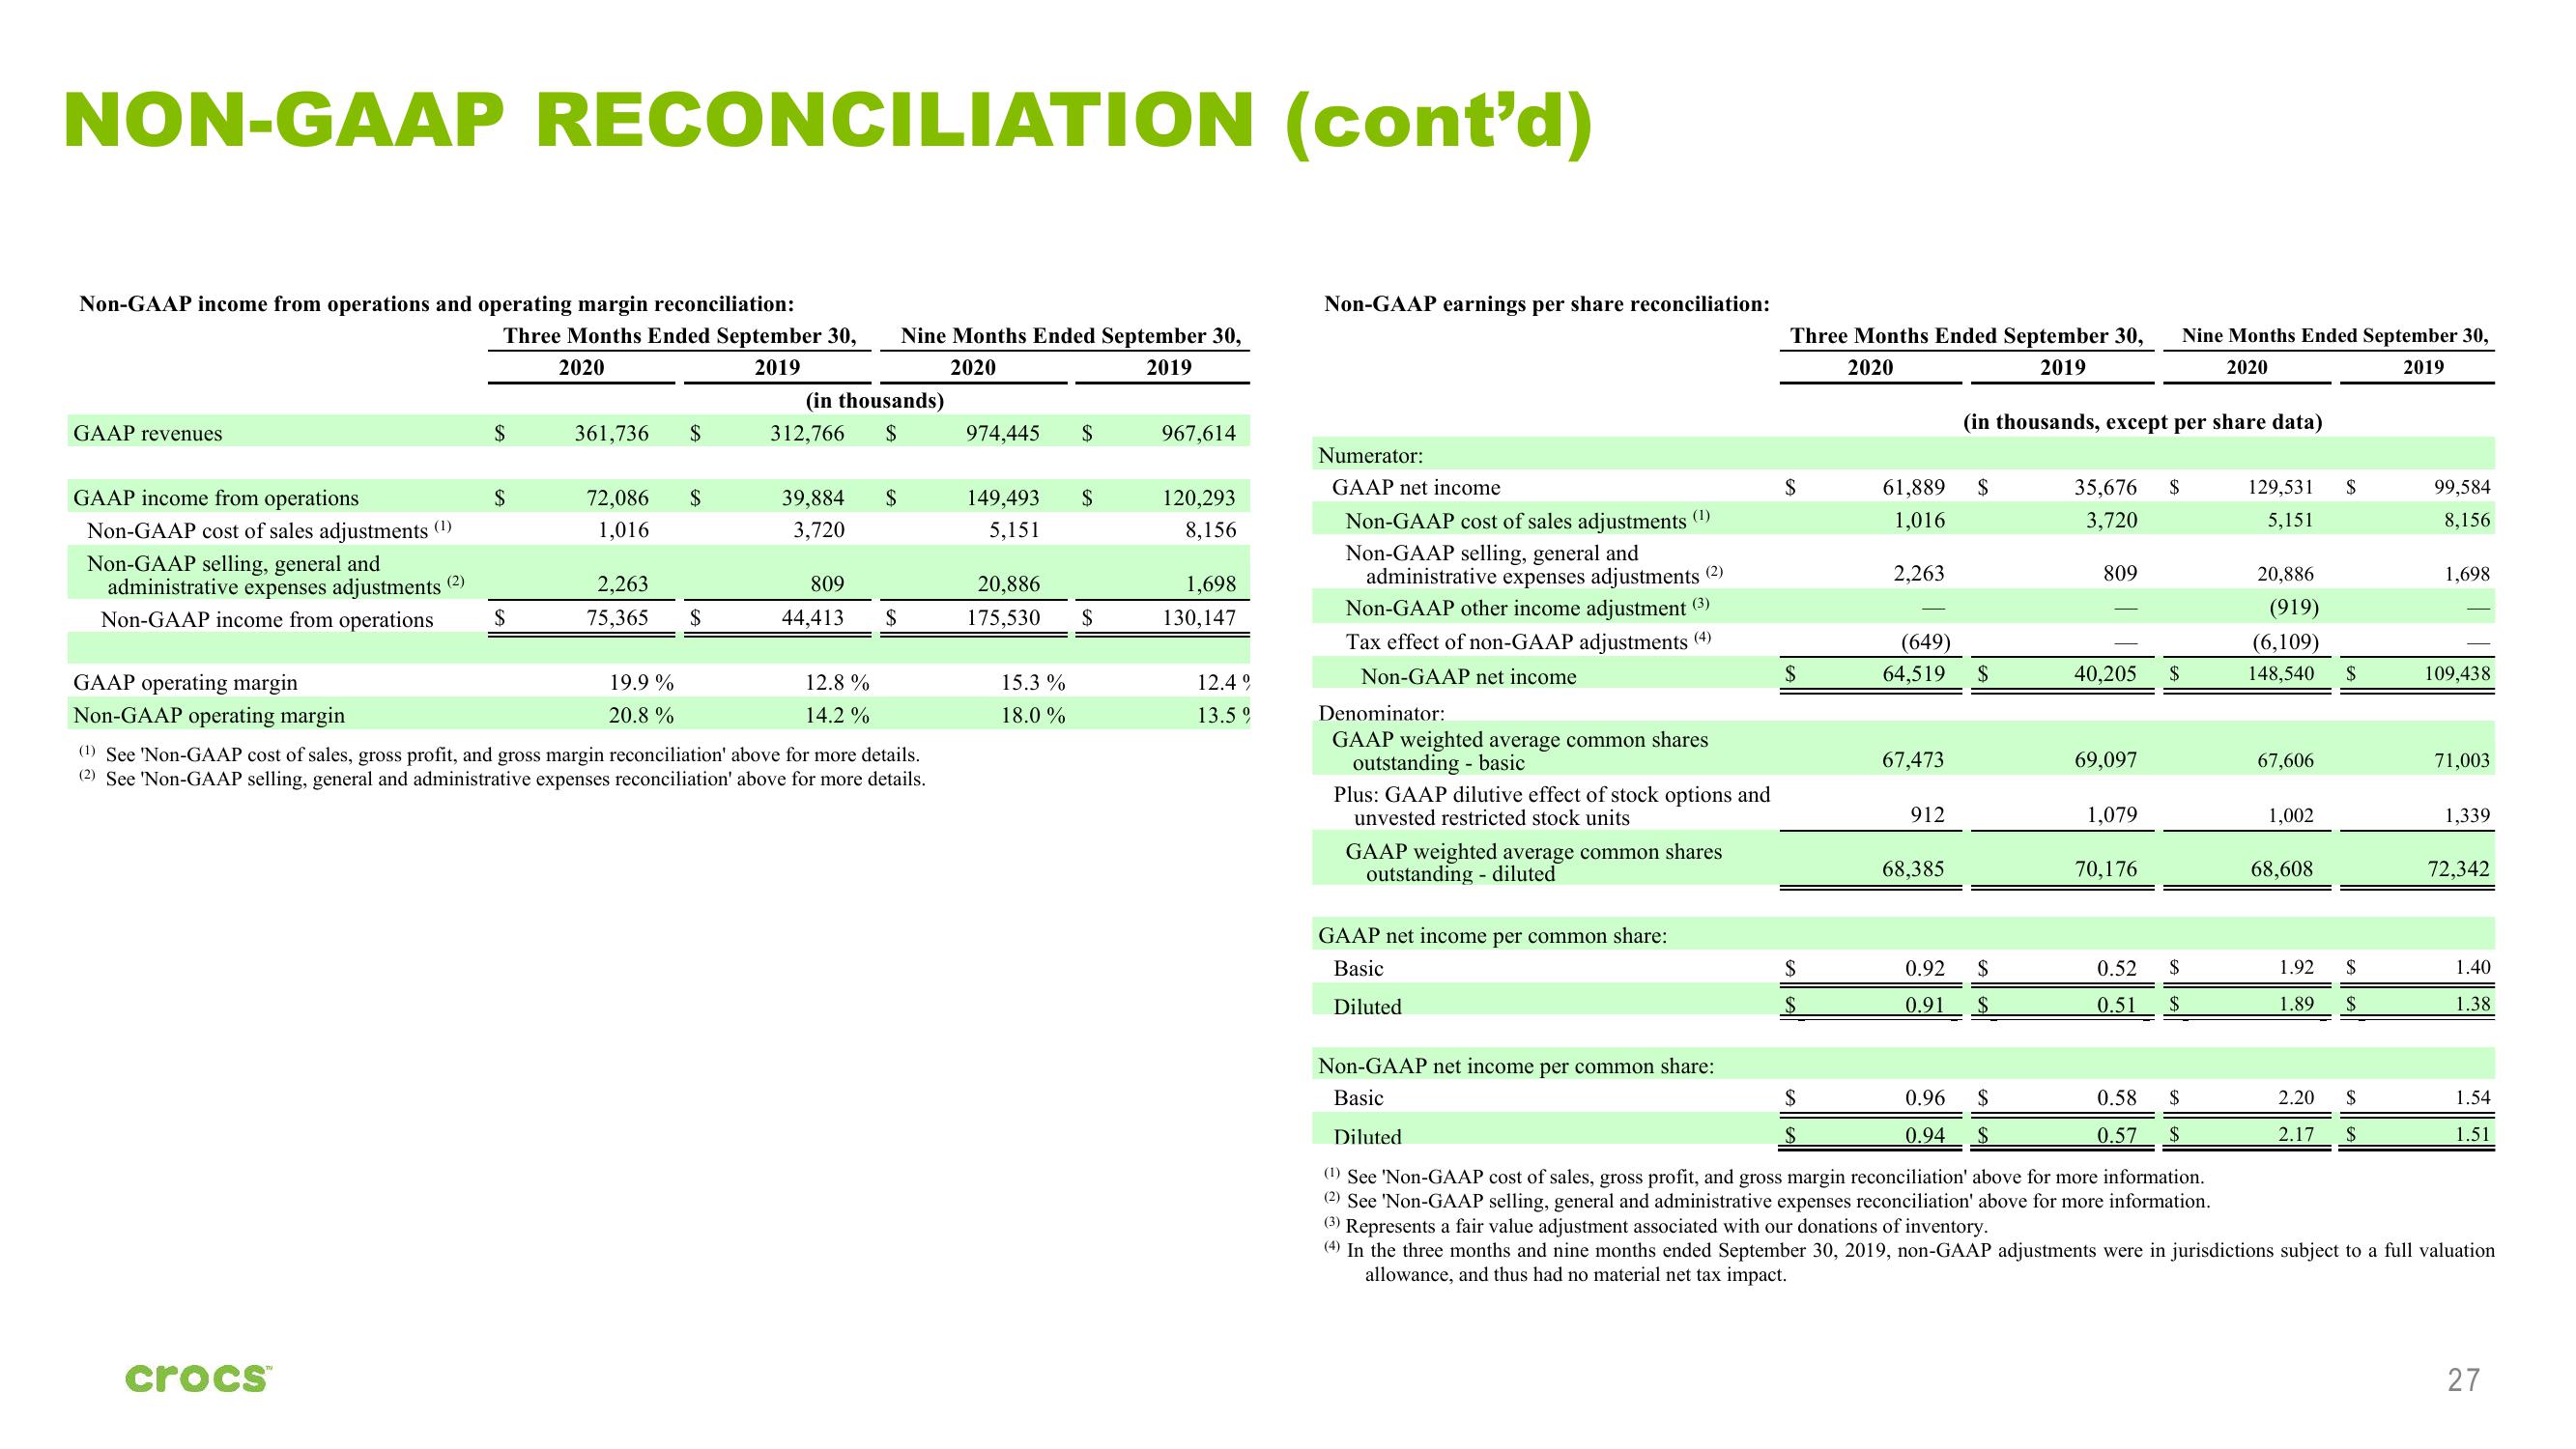
Non-GAAP income from operations and operating margin reconciliation:
GAAP revenues
GAAP income from operations
Non-GAAP cost of sales adjustments (¹)
Non-GAAP selling, general and
administrative expenses adjustments (2)
Non-GAAP income from operations
Three Months Ended September 30, Nine Months Ended September 30,
2020
2019
2020
2019
crocs™
$
$
$
361,736 $
72,086 $
1,016
2,263
75,365
$
19.9 %
20.8%
(in thousands)
312,766 $
39,884 $
3,720
809
44,413
GAAP operating margin
Non-GAAP operating margin
(1) See 'Non-GAAP cost of sales, gross profit, and gross margin reconciliation' above for more details.
(2) See 'Non-GAAP selling, general and administrative expenses reconciliation' above for more details.
$
12.8%
14.2%
974,445 $
149,493
5,151
20,886
175,530
15.3%
18.0%
$
$
967,614
120,293
8,156
1,698
130,147
12.49
13.59
Non-GAAP earnings per share reconciliation:
Numerator:
GAAP net income
Non-GAAP cost of sales adjustments (¹)
Non-GAAP selling, general and
administrative expenses adjustments (2)
Non-GAAP other income adjustment (3)
Tax effect of non-GAAP adjustments (4)
Non-GAAP net income
Denominator:
GAAP weighted average common shares
outstanding - basic
Plus: GAAP dilutive effect of stock options and
unvested restricted stock units
GAAP weighted average common shares
outstanding - diluted
GAAP net income per common share:
Basic
Diluted
Three Months Ended September 30, Nine Months Ended September 30,
2020
2019
2020
2019
$
$
$
61,889
1,016
$
$
2,263
(649)
64,519
67,473
912
68,385
(in thousands, except per share data)
$
$
0.92 $
0.91
35,676
3,720
0.96 $
0.94 $
809
40,205
69,097
1,079
70,176
0.52
0.51
$
Non-GAAP net income per common share:
Basic
Diluted
(1) See 'Non-GAAP cost of sales, gross profit, and gross margin reconciliation' above for more information.
(2) See 'Non-GAAP selling, general and administrative expenses reconciliation' above for more information.
0.58
0.57
$
$
$
$
$
129,531
5,151
20,886
(919)
(6,109)
148,540
67,606
1,002
68,608
$
$
$
1.92
1.89 $
2.20 $
2.17 $
99,584
8,156
1,698
109,438
71,003
1,339
72,342
1.40
1.38
1.54
1.51
(3) Represents a fair value adjustment associated with our donations of inventory.
(4) In the three months and nine months ended September 30, 2019, non-GAAP adjustments were in jurisdictions subject to a full valuation
allowance, and thus had no material net tax impact.
27View entire presentation