Acast Results Presentation Deck
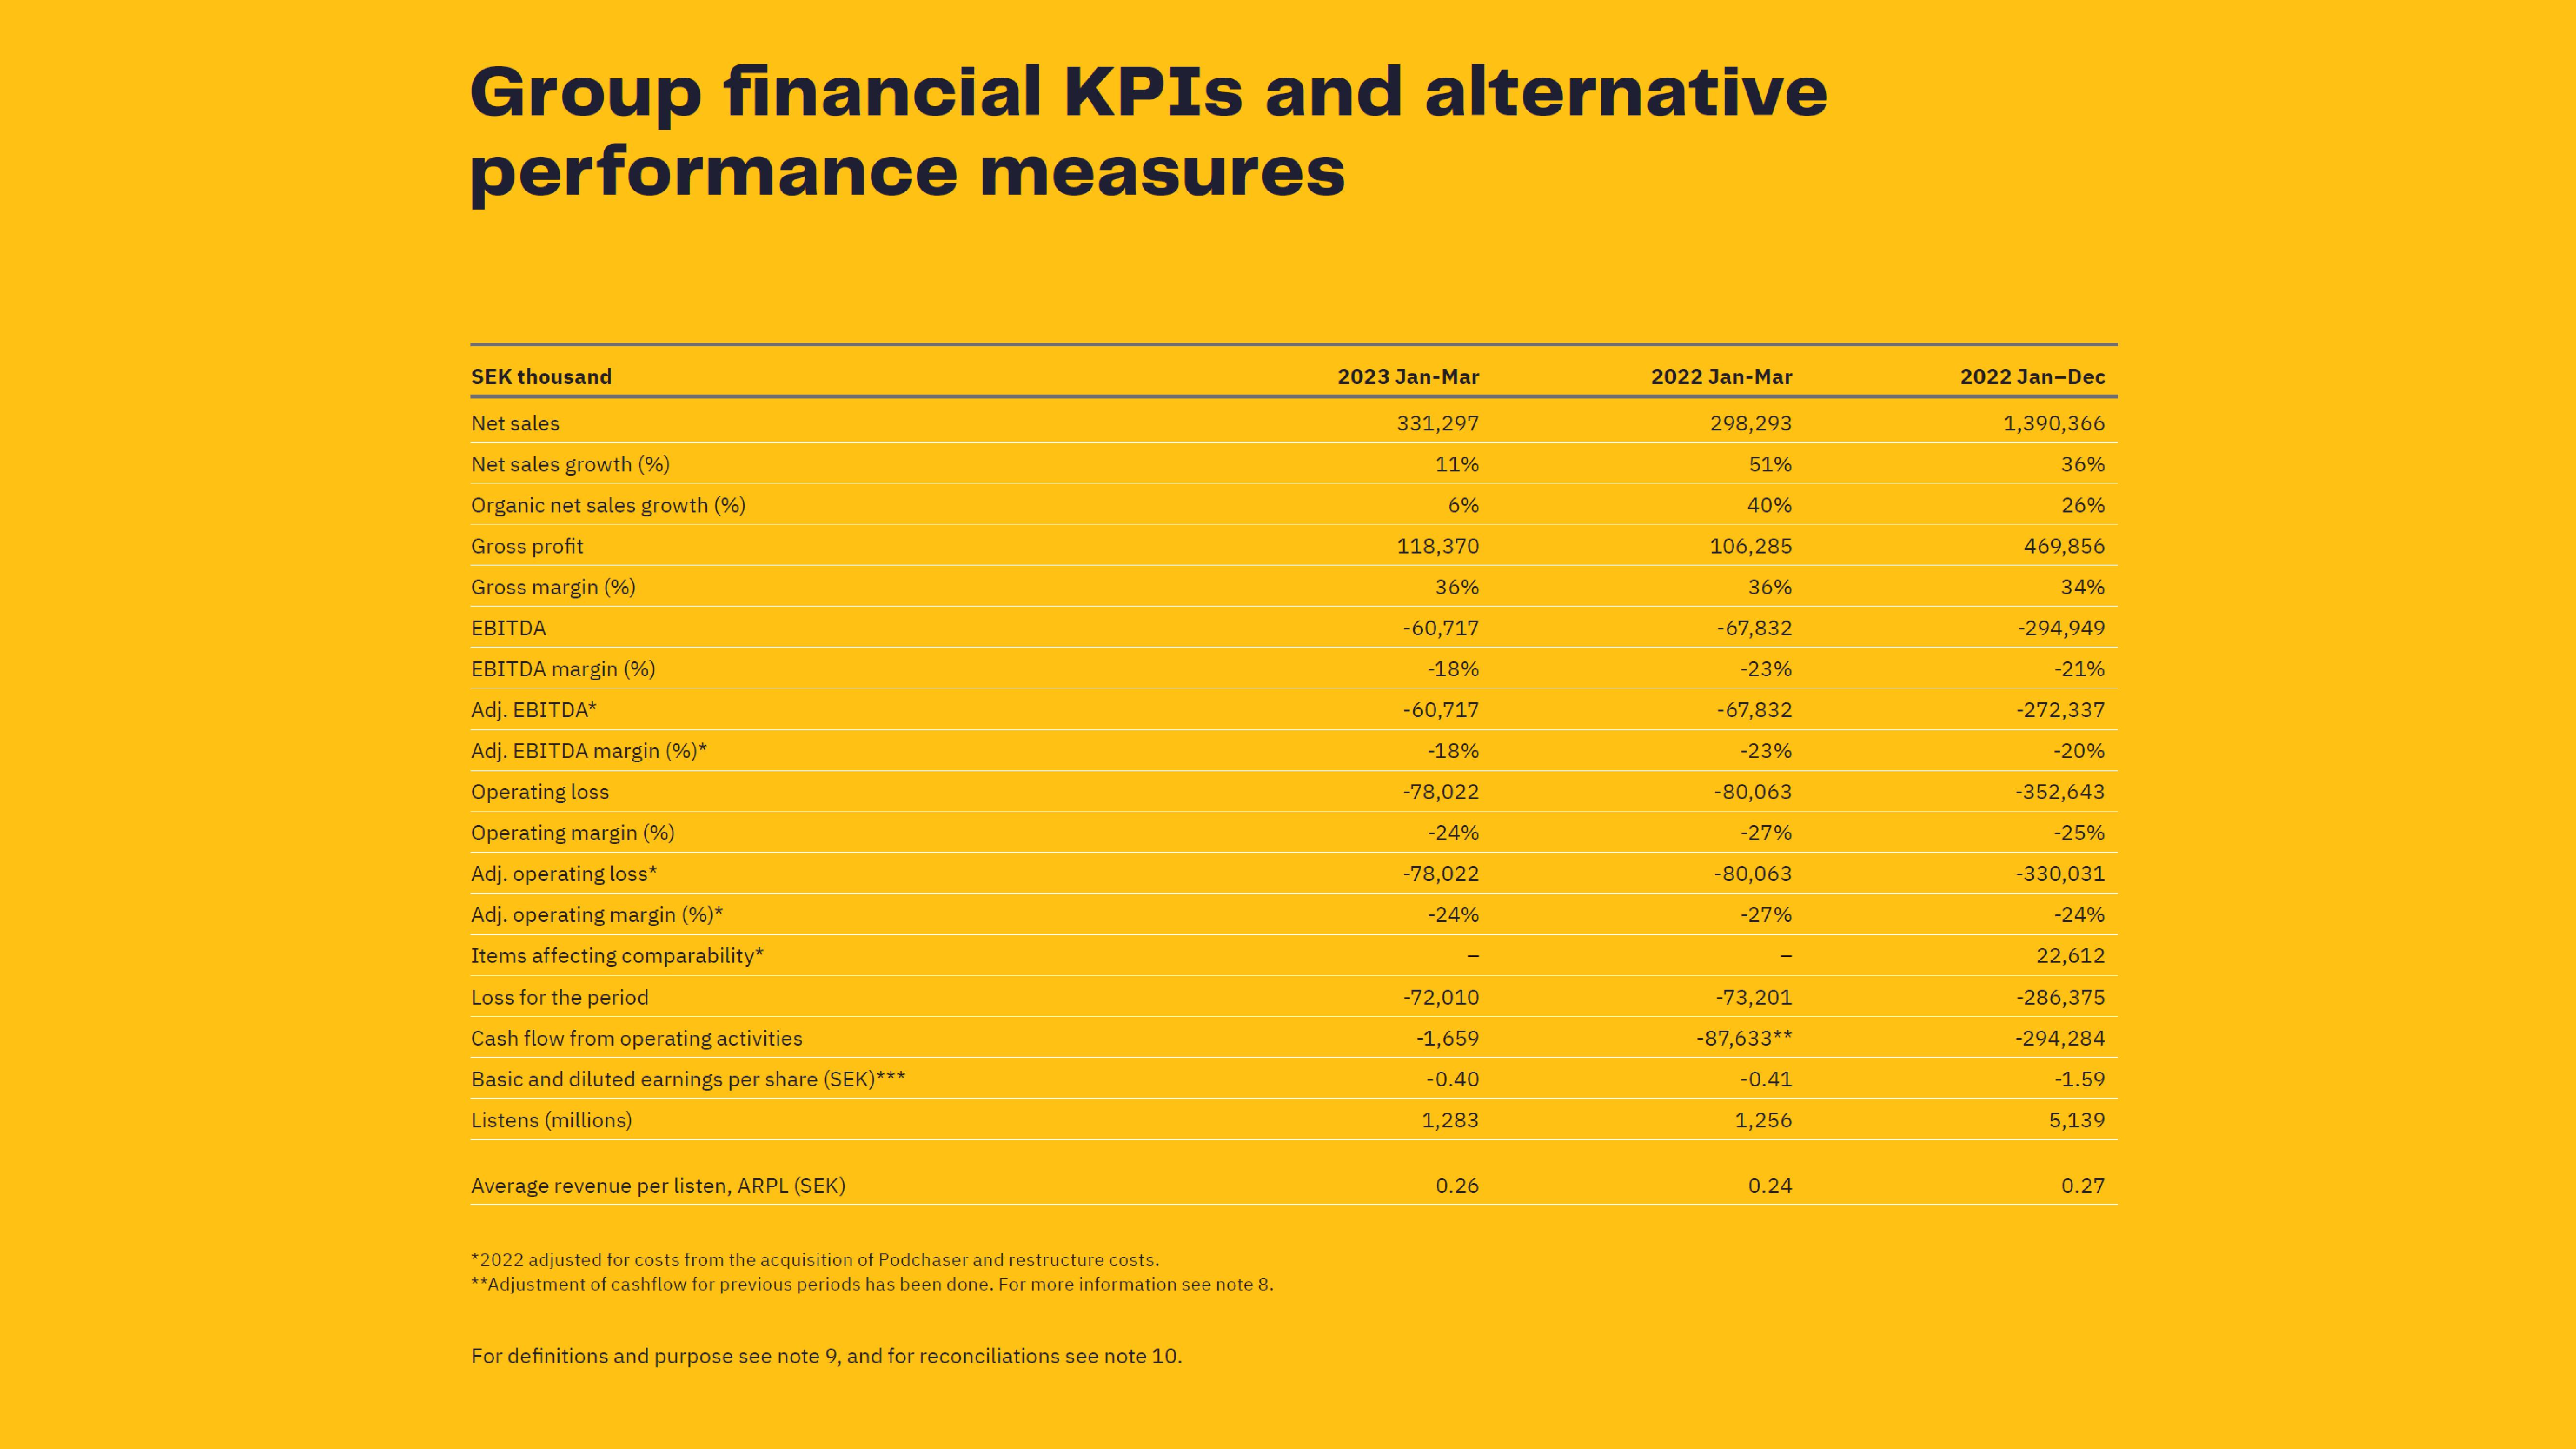
Group financial KPIs and alternative
performance measures
SEK thousand
Net sales
Net sales growth (%)
Organic net sales growth (%)
Gross profit
Gross margin (%)
EBITDA
EBITDA margin (%)
Adj. EBITDA*
Adj. EBITDA margin (%)*
Operating loss
Operating margin (%)
Adj. operating loss*
Adj. operating margin (%)*
Items affecting comparability*
Loss for the period
Cash flow from operating activities
Basic and diluted earnings per share (SEK)***
Listens (millions)
Average revenue per listen, ARPL (SEK)
*2022 adjusted for costs from the acquisition of Podchaser and restructure costs.
**Adjustment of cashflow for previous periods has been done. For more information see note 8.
For definitions and purpose see note 9, and for reconciliations see note 10.
2023 Jan-Mar
331,297
11%
6%
118,370
36%
-60,717
-18%
-60,717
-18%
-78,022
-24%
-78,022
-24%
-72,010
-1,659
-0.40
1,283
0.26
2022 Jan-Mar
298,293
51%
40%
106,285
36%
-67,832
-23%
-67,832
-23%
-80,063
-27%
-80,063
-27%
-73,201
-87,633**
-0.41
1,256
0.24
2022 Jan-Dec
1,390,366
36%
26%
469,856
34%
-294,949
-21%
-272,337
-20%
-352,643
-25%
-330,031
-24%
22,612
-286,375
-294,284
-1.59
5,139
0.27View entire presentation