Wix Results Presentation Deck
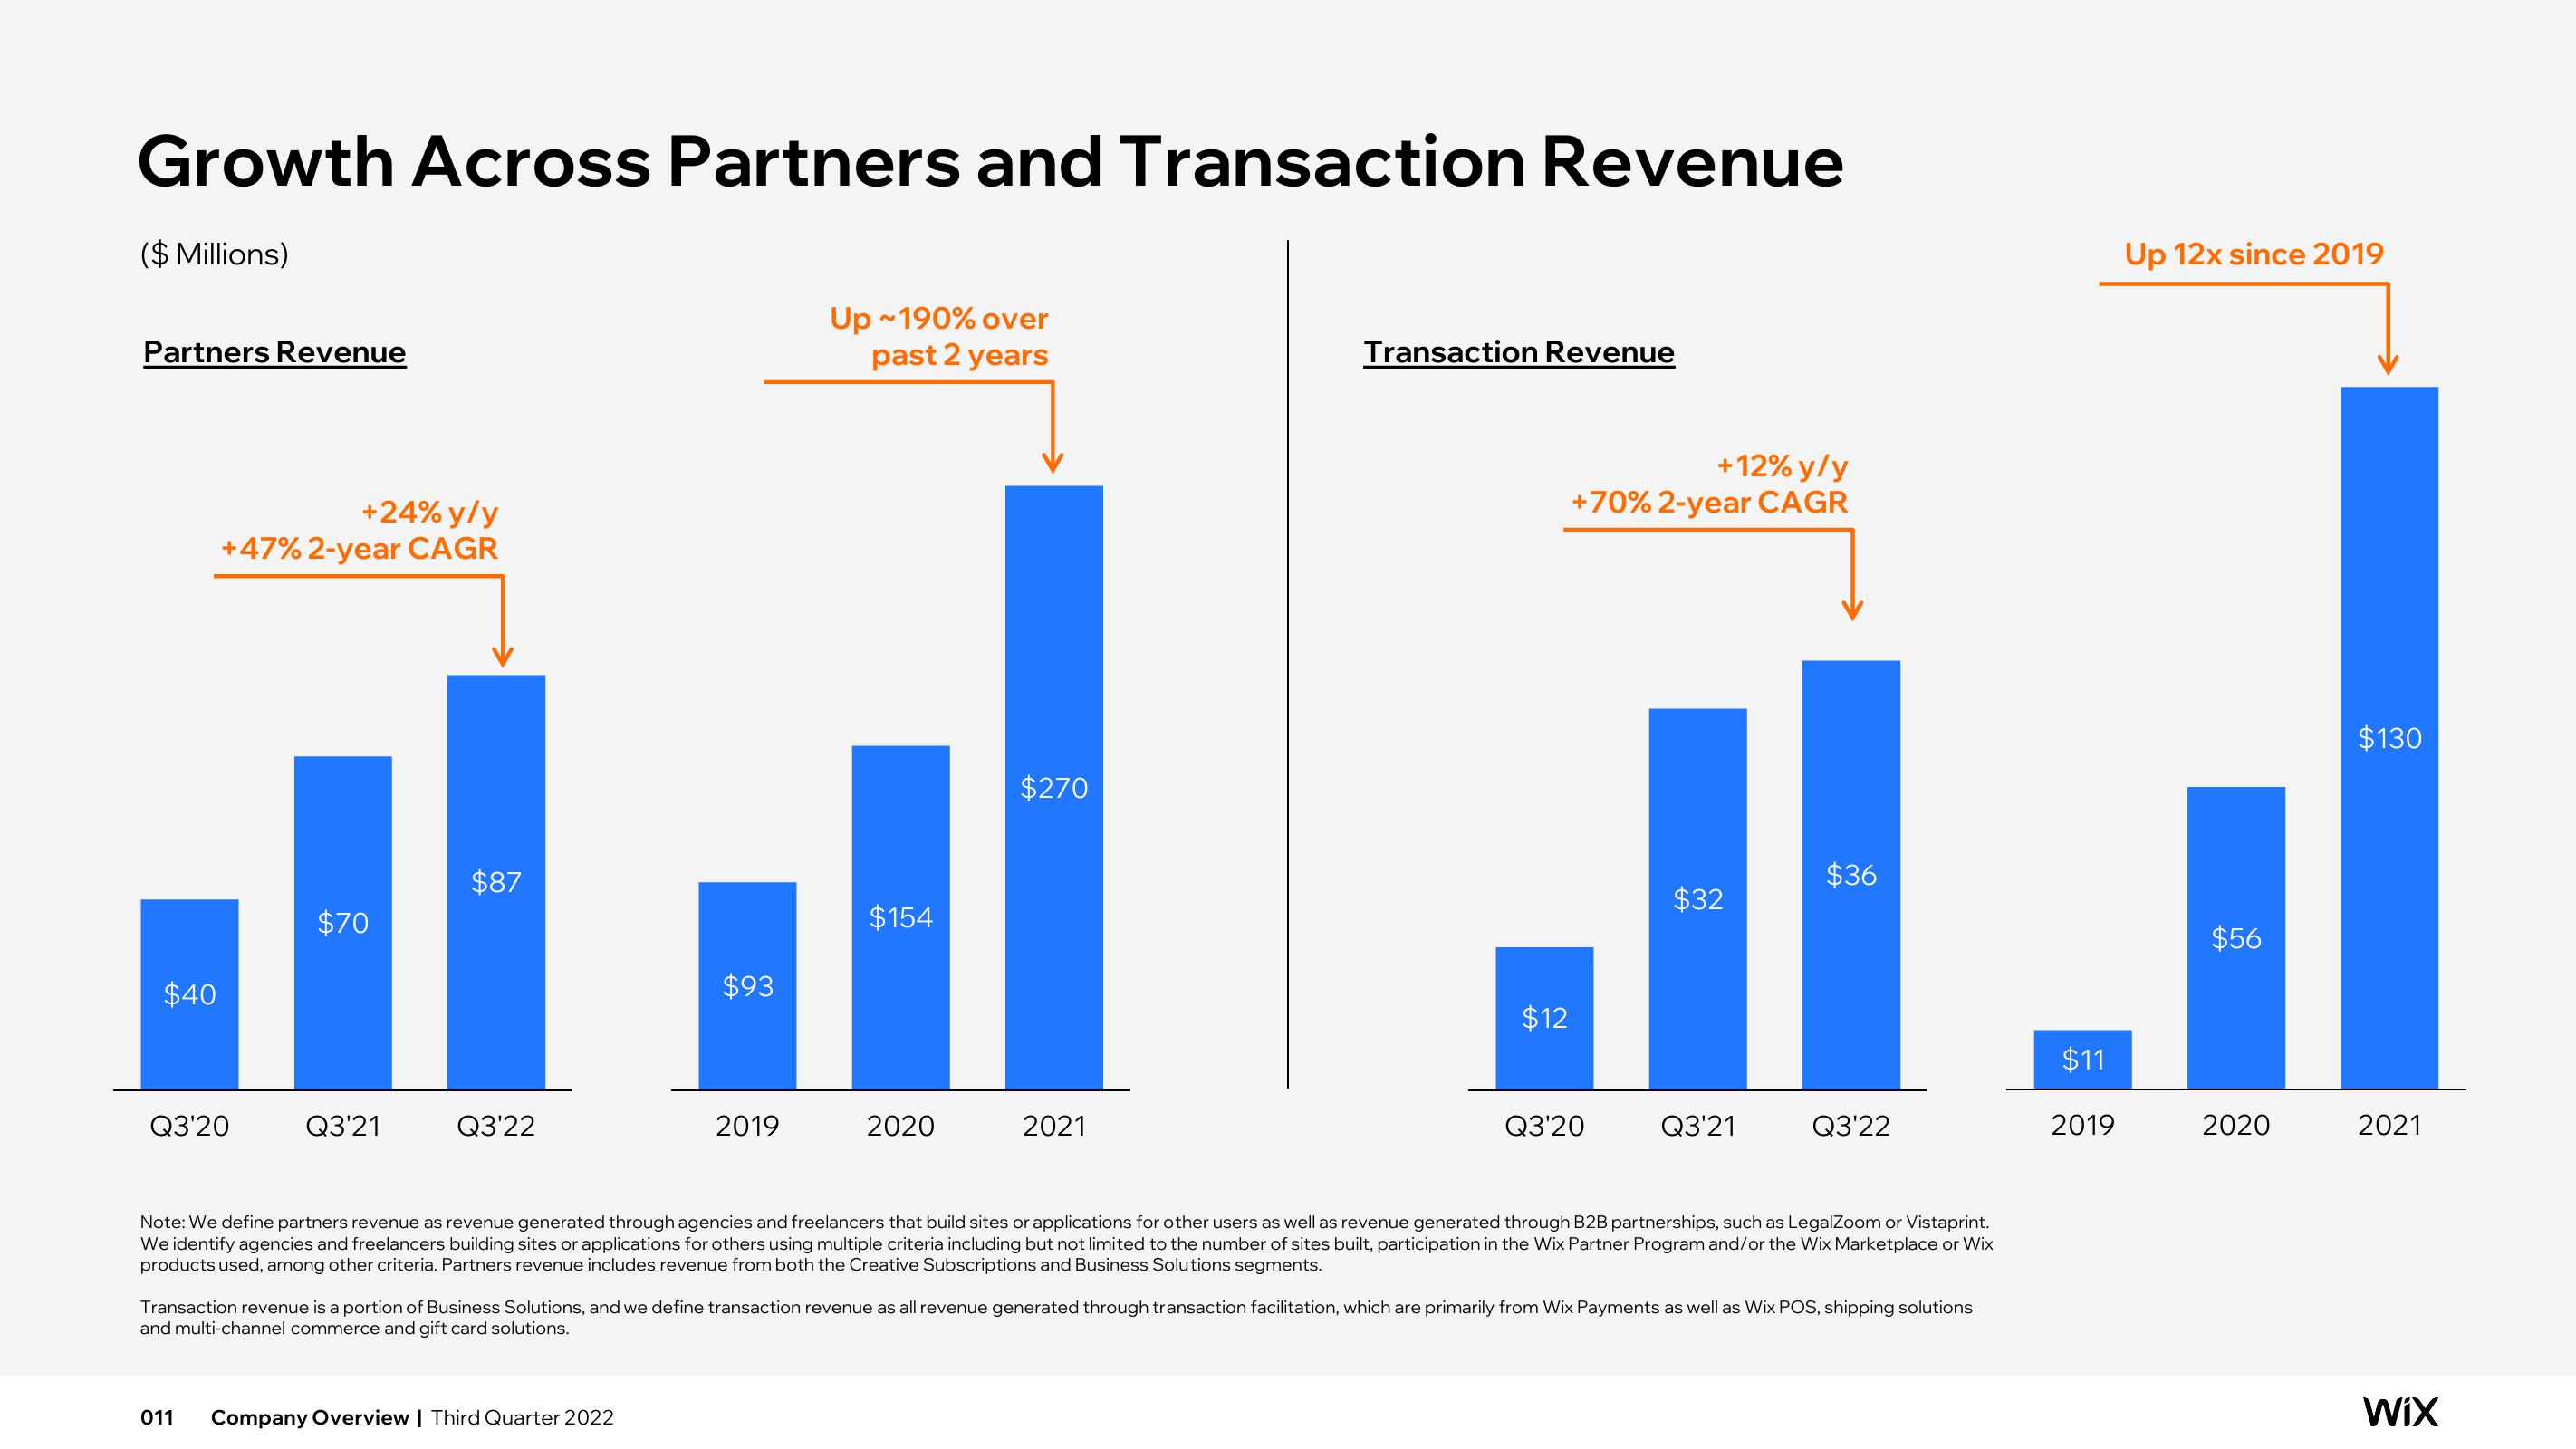
Growth Across Partners and Transaction Revenue
($ Millions)
Partners Revenue
$40
+24% y/y
+47% 2-year CAGR
Q3'20
$70
011
Q3'21
$87
Q3'22
$93
2019
Company Overview | Third Quarter 2022
Up~190% over
past 2 years
$154
2020
$270
2021
Transaction Revenue
$12
+12% y/y
+70% 2-year CAGR
Q3'20
$32
Q3'21
$36
Note: We define partners revenue as revenue generated through agencies and freelancers that build sites or applications for other users as well as revenue generated through B2B partnerships, such as LegalZoom or Vistaprint.
We identify agencies and freelancers building sites or applications for others using multiple criteria including but not limited to the number of sites built, participation in the Wix Partner Program and/or the Wix Marketplace or Wix
products used, among other criteria. Partners revenue includes revenue from both the Creative Subscriptions and Business Solutions segments.
Q3'22
Transaction revenue is a portion of Business Solutions, and we define transaction revenue as all revenue generated through transaction facilitation, which are primarily from Wix Payments as well as Wix POS, shipping solutions
and multi-channel commerce and gift card solutions.
$11
2019
Up 12x since 2019
$56
2020
$130
2021
WIXView entire presentation