AgroFresh SPAC Presentation Deck
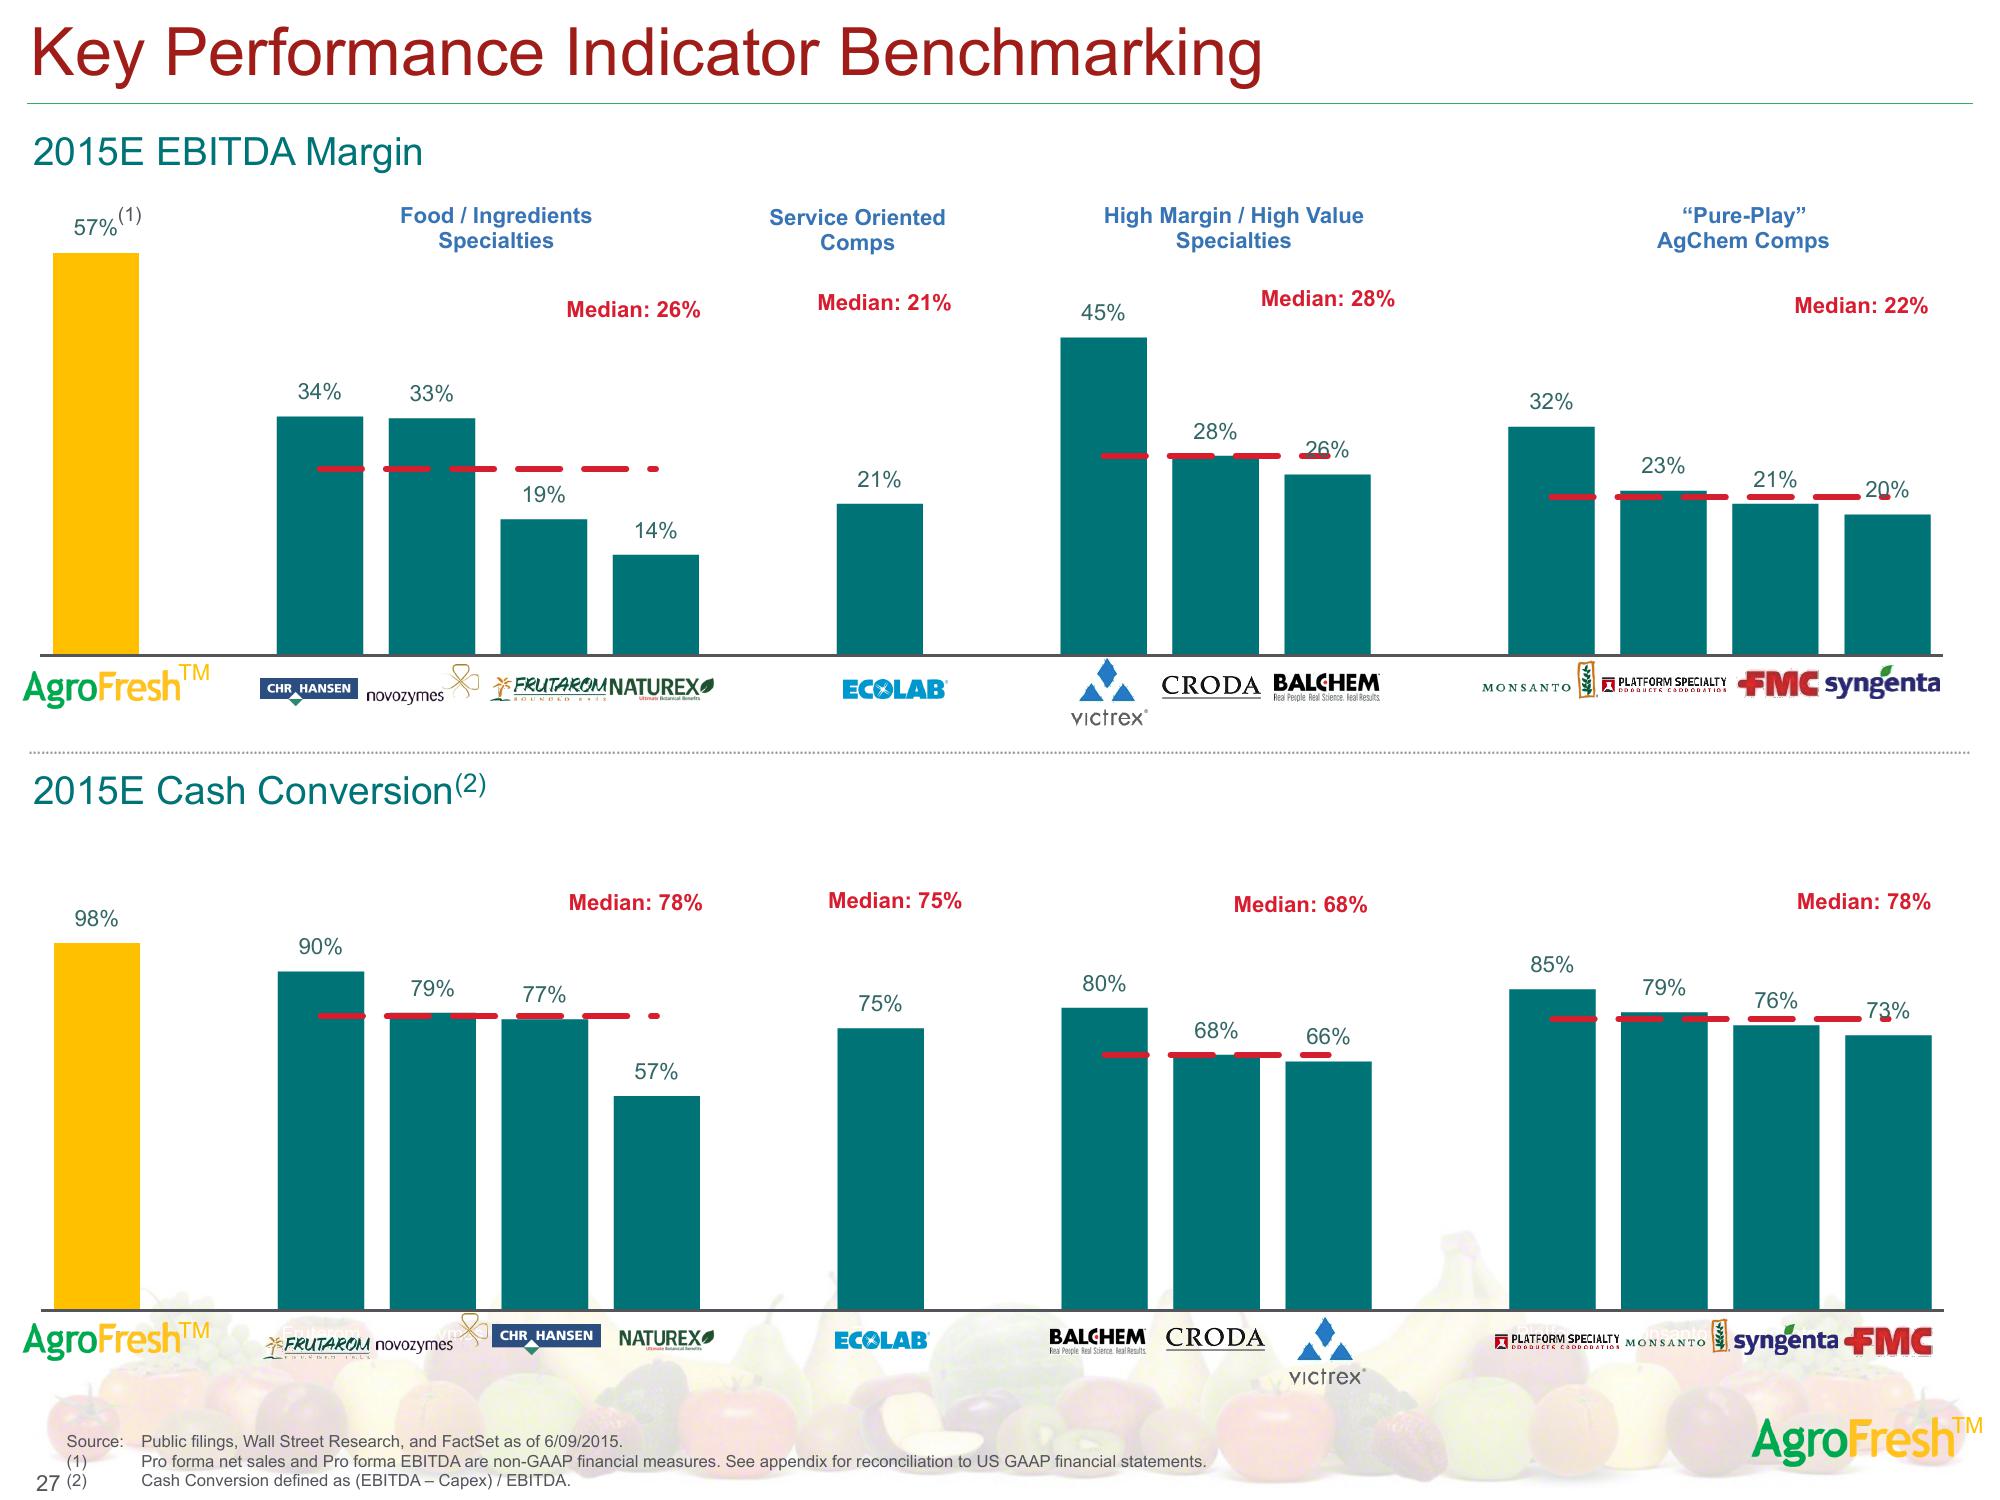
Key Performance Indicator Benchmarking
2015E EBITDA Margin
57% (1)
AgroFresh
98%
TM
AgroFreshTM
Source:
(1)
27 (2)
34%
CHR HANSEN
2015E Cash Conversion (2)
Food / Ingredients
Specialties
90%
33%
novozymes
79%
FRUTAROM novozymes
19%
Median: 26%
77%
FRUTAROMNATUREX
14%
Median: 78%
CHR HANSEN
57%
NATUREX
Service Oriented
Comps
Median: 21%
21%
ECOLAB
Median: 75%
75%
ECOLAB
High Margin / High Value
Specialties
45%
Victrex®
80%
28%
Median: 28%
CRODA BALCHEM
Real People Real Science. Real Results
68%
Public filings, Wall Street Research, and FactSet as of 6/09/2015.
Pro forma net sales and Pro forma EBITDA are non-GAAP financial measures. See appendix for reconciliation to US GAAP financial statements.
Cash Conversion defined as (EBITDA - Capex) / EBITDA.
26%
Median: 68%
BALCHEM CRODA
Real People Real Science RealResults
66%
Victrex®
32%
MONSANTO
85%
"Pure-Play"
AgChem Comps
23%
PLATFORM SPECIALTY
DDDDUCTE CODDODATION
79%
PLATFORM SPECIALTY MONSANTO
DOODUCTS COODORATION
Median: 22%
21%
20%
FMC syngenta
76%
Median: 78%
73%
syngenta FMC
AgroFresh™MView entire presentation