Vivid Seats SPAC Presentation Deck
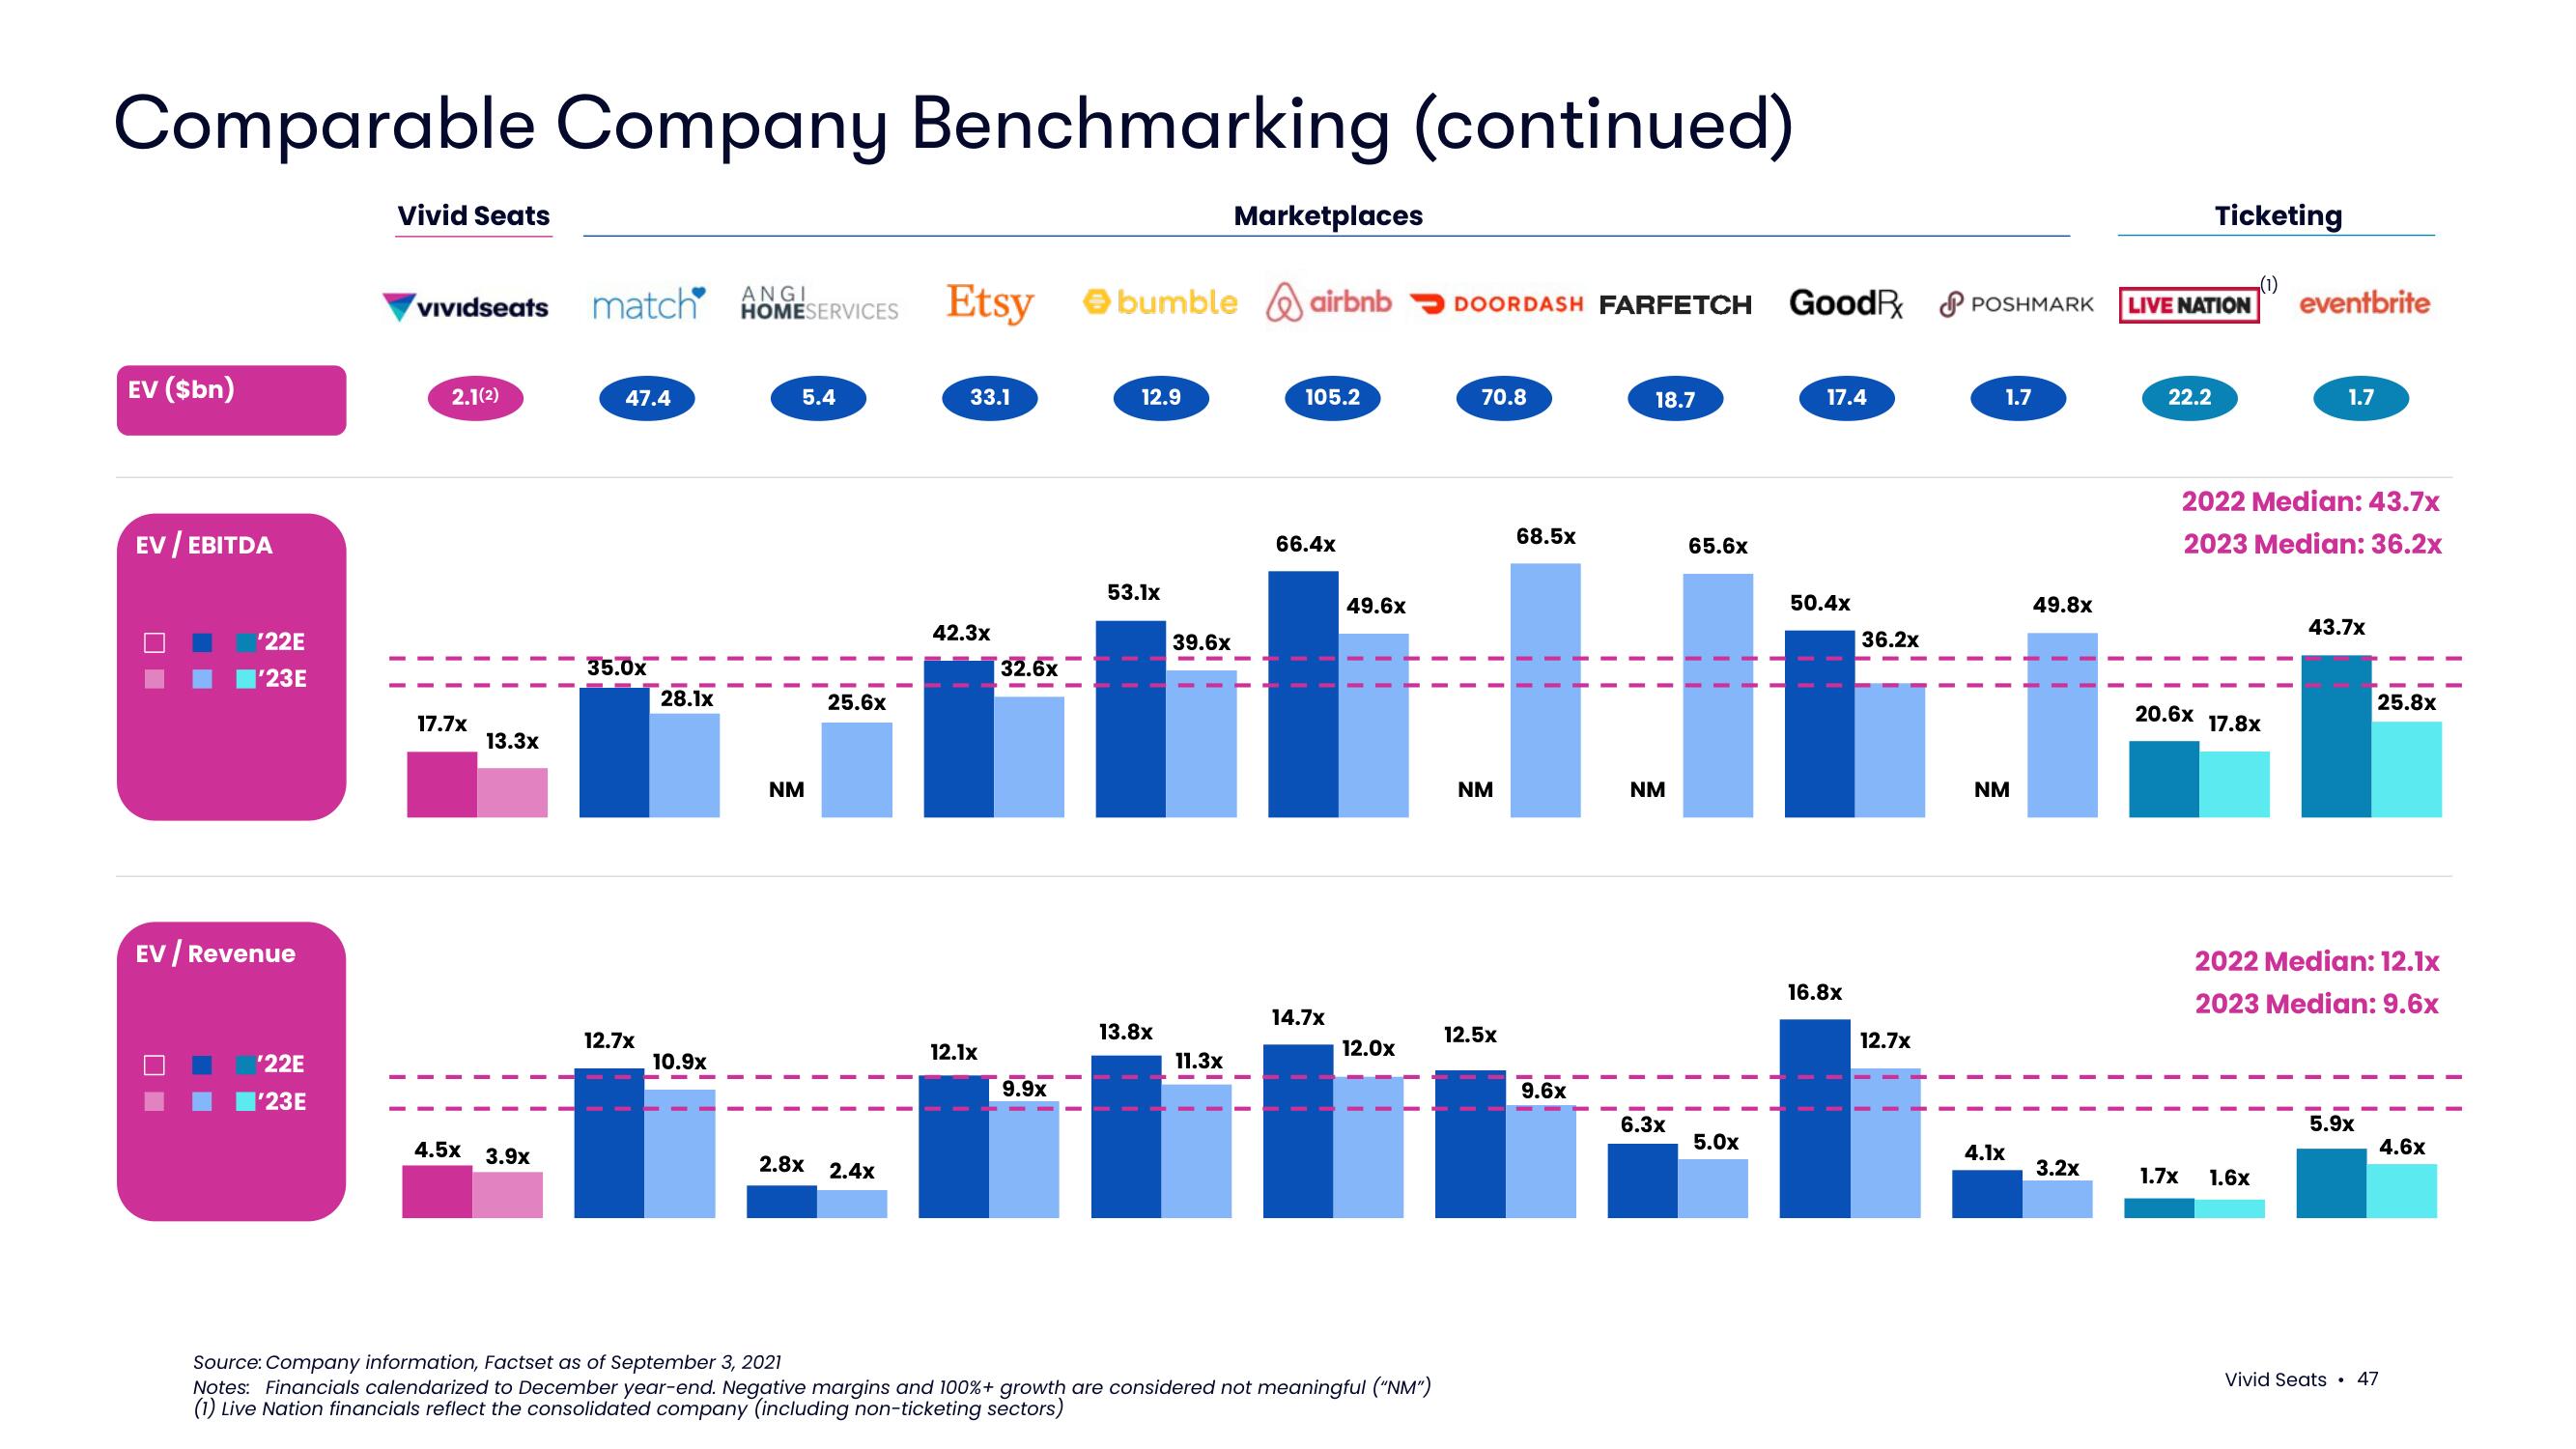
Comparable Company Benchmarking (continued)
EV ($bn)
EV / EBITDA
¹22E
'23E
EV / Revenue
'22E
I'23E
Vivid Seats
Vividseats
2.1(2)
17.7x
13.3x
4.5x 3.9x
ANGI
match HOMESERVICES
47.4
35.0x
12.7x
28.1x
10.9x
5.4
NM
25.6x
2.8x 2.4x
Etsy
33.1
42.3x
12.1x
32.6x
9.9x
12.9
bumble airbnb DOORDASH FARFETCH Good PX POSHMARK LIVE NATION
53.1x
13.8x
39.6x
Marketplaces
11.3x
105.2
66.4x
14.7x
49.6x
12.0x
Source: Company information, Factset as of September 3, 2021
Notes: Financials calendarized to December year-end. Negative margins and 100% + growth are considered not meaningful ("NM")
(1) Live Nation financials reflect the consolidated company (including non-ticketing sectors)
70.8
NM
12.5x
68.5x
9.6x
18.7
NM
6.3x
65.6x
5.0x
17.4
50.4x
16.8x
36.2x
12.7x
1.7
NM
4.1x
49.8x
3.2x
22.2
Ticketing
20.6x
1.7x
2022 Median: 43.7x
2023 Median: 36.2x
17.8x
eventbrite
1.7
1.6x
43.7x
2022 Median: 12.1x
2023 Median: 9.6x
25.8x
5.9x
4.6x
Vivid Seats . 47View entire presentation