Pathward Financial Results Presentation Deck
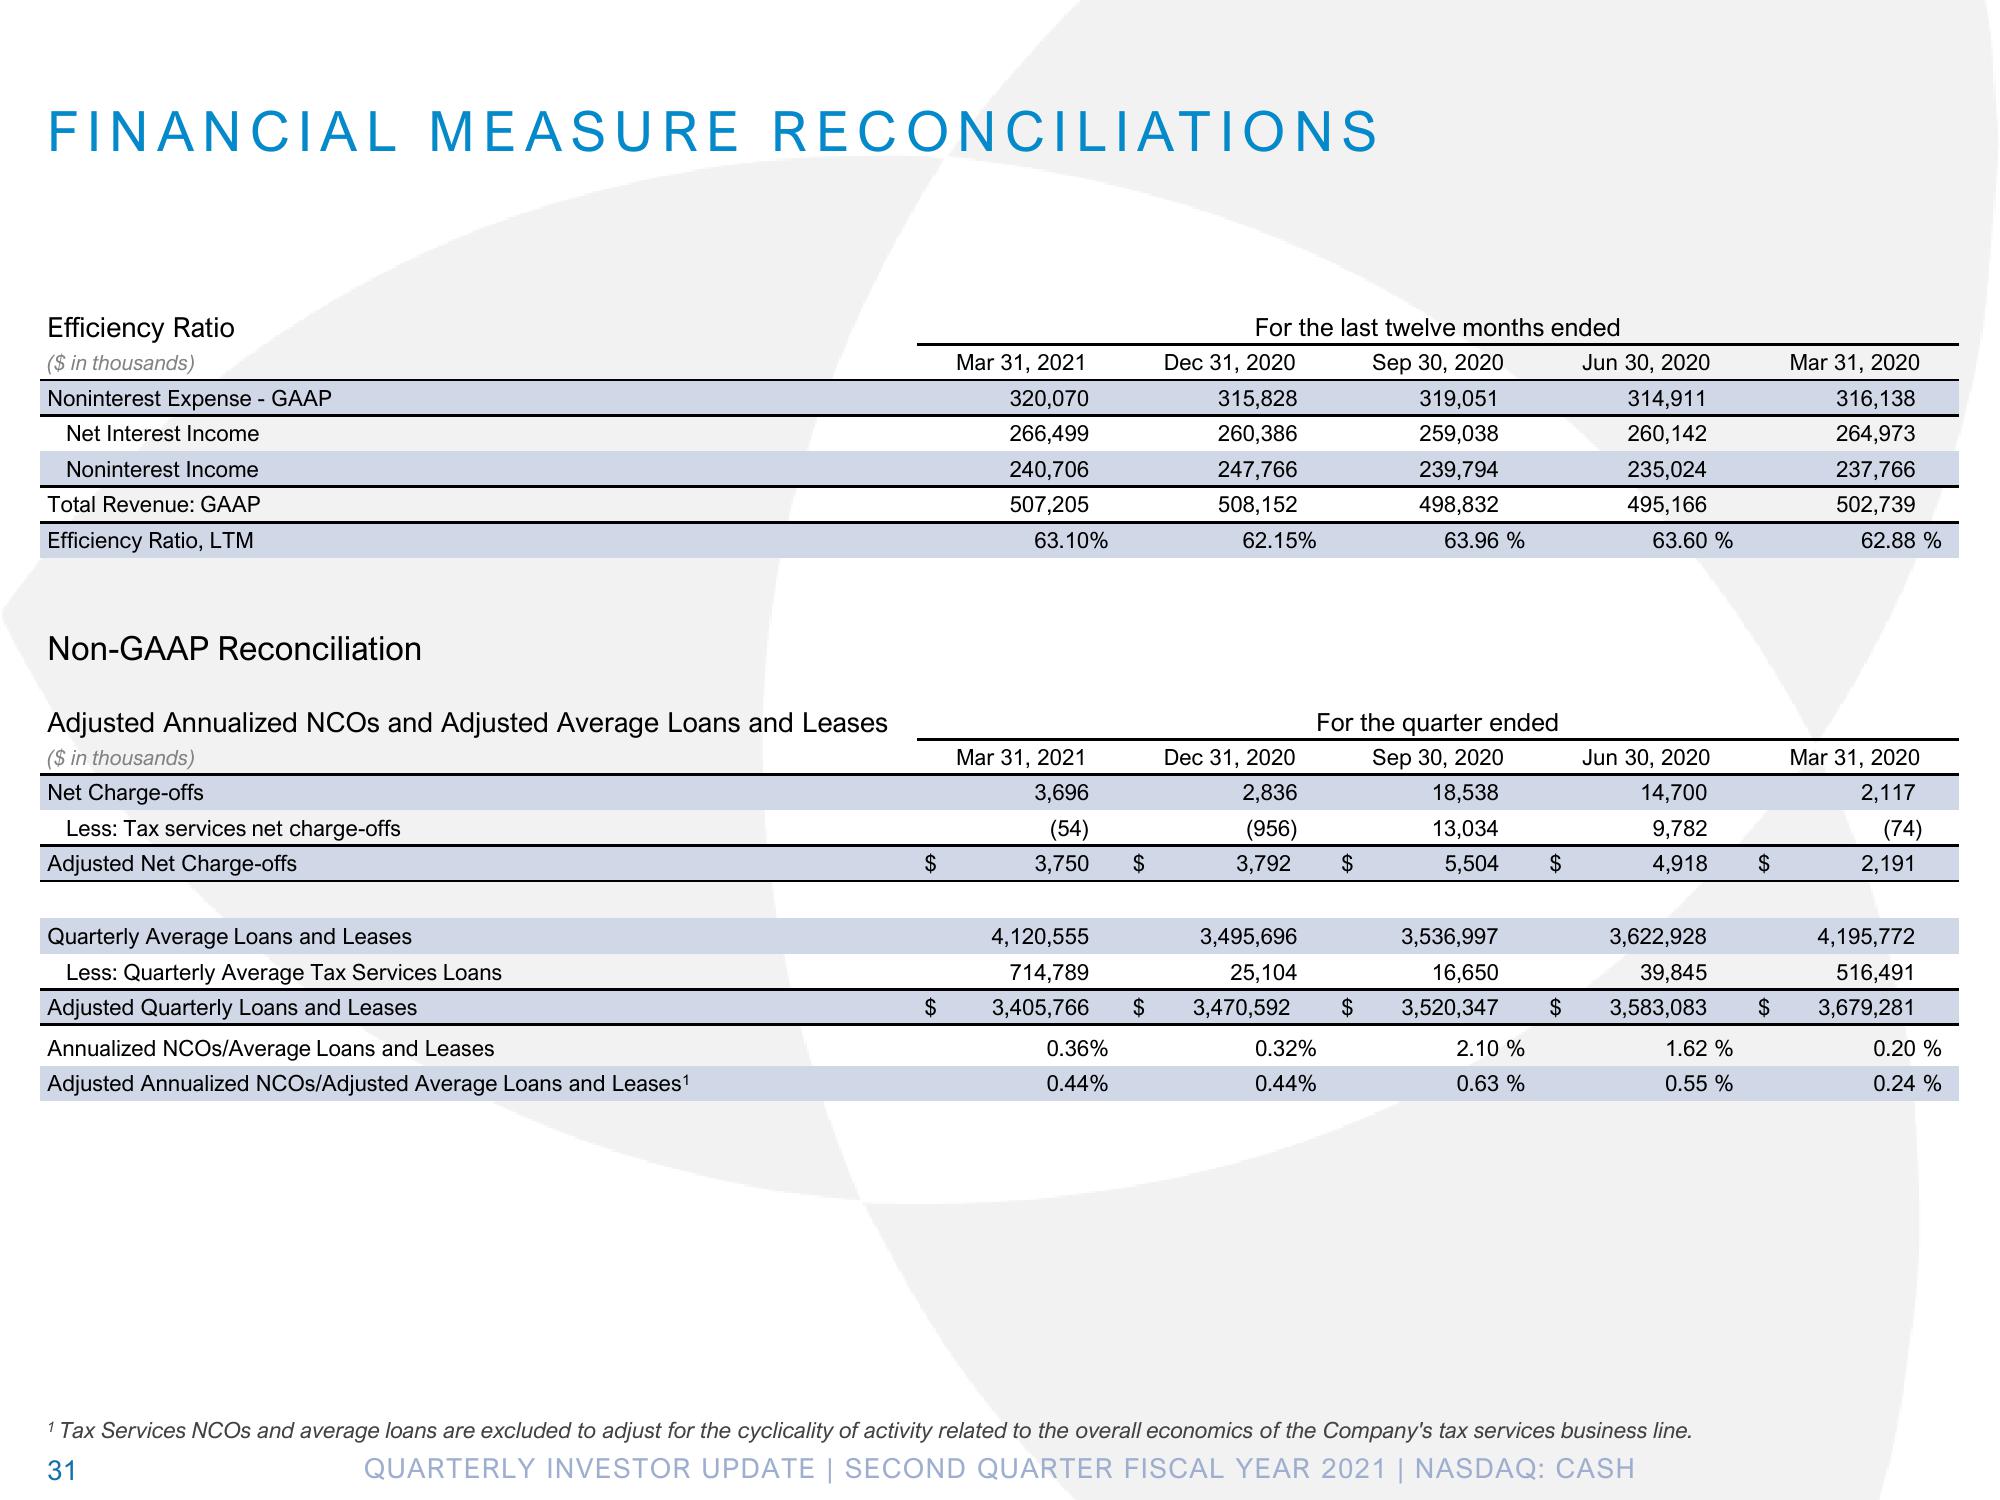
FINANCIAL MEASURE RECONCILIATIONS
Efficiency Ratio
($ in thousands)
Noninterest Expense - GAAP
Net Interest Income
Noninterest Income
Total Revenue: GAAP
Efficiency Ratio, LTM
Non-GAAP Reconciliation
Adjusted Annualized NCOS and Adjusted Average Loans and Leases
($ in thousands)
Net Charge-offs
Less: Tax services net charge-offs
Adjusted Net Charge-offs
Quarterly Average Loans and Leases
Less: Quarterly Average Tax Services Loans
Adjusted Quarterly Loans and Leases
Annualized NCOS/Average Loans and Leases
Adjusted Annualized NCOS/Adjusted Average Loans and Leases¹
$
$
Mar 31, 2021
320,070
266,499
240,706
507,205
63.10%
Mar 31, 2021
3,696
(54)
3,750
4,120,555
714,789
3,405,766
0.36%
0.44%
$
$
For the last twelve months ended
Sep 30, 2020
Dec 31, 2020
315,828
260,386
247,766
508,152
62.15%
Dec 31, 2020
2,836
(956)
3,792
0.32%
0.44%
319,051
259,038
239,794
498,832
$
63.96 %
For the quarter ended
Sep 30, 2020
18,538
13,034
5,504
3,495,696
3,536,997
25,104
16,650
3,470,592 $ 3,520,347 $
$
2.10 %
0.63 %
Jun 30, 2020
314,911
260,142
235,024
495,166
63.60 %
Jun 30, 2020
14,700
9,782
4,918
3,622,928
39,845
3,583,083
1.62%
0.55 %
1 Tax Services NCOs and average loans are excluded to adjust for the cyclicality of activity related to the overall economics of the Company's tax services business line.
QUARTERLY INVESTOR UPDATE | SECOND QUARTER FISCAL YEAR 2021 | NASDAQ: CASH
31
$
$
Mar 31, 2020
316,138
264,973
237,766
502,739
62.88 %
Mar 31, 2020
2,117
(74)
2,191
4,195,772
516,491
3,679,281
0.20 %
0.24 %View entire presentation