Toyota Investor Presentation Deck
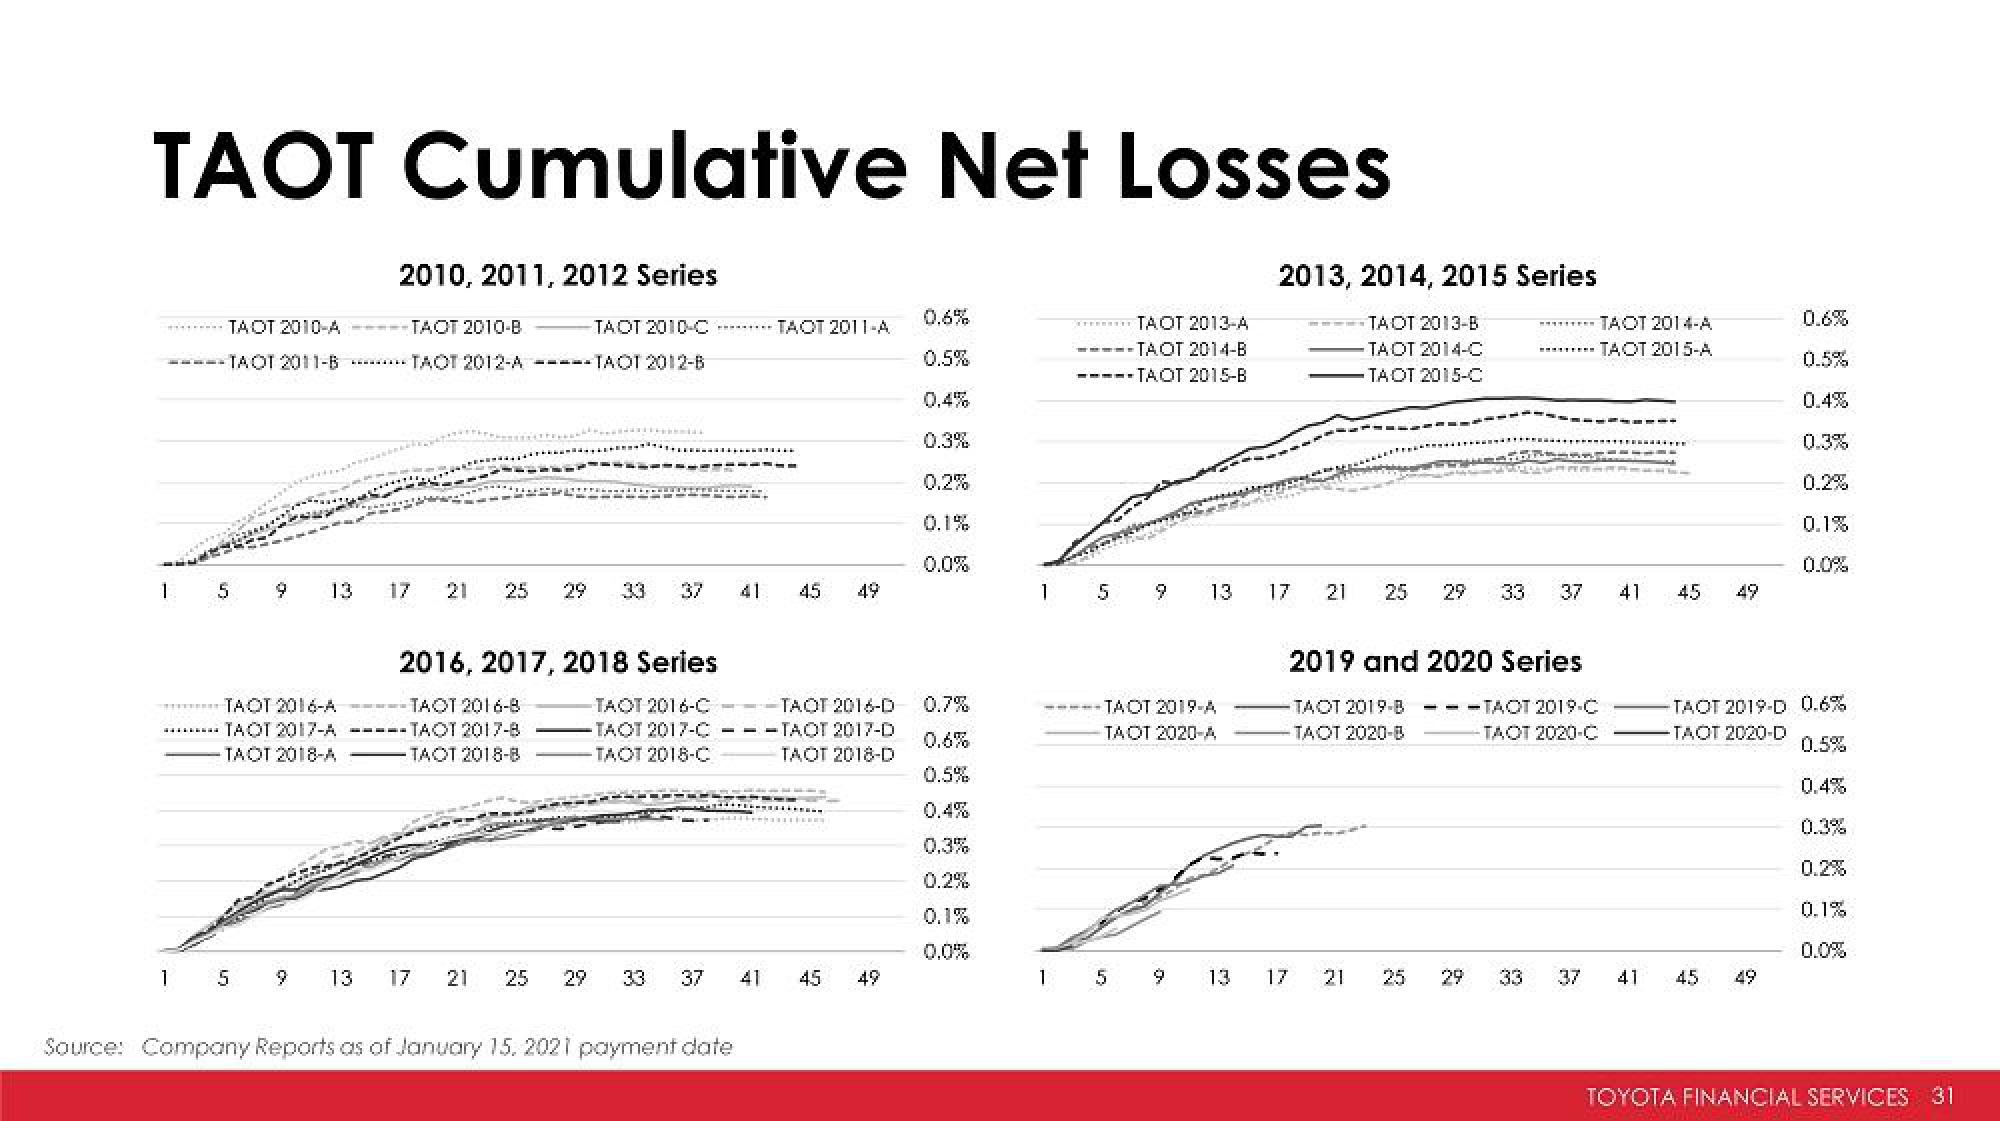
TAOT Cumulative Net Losses
1
1
TAOT 2010-A
---TAOT 2011-B
9
TAOT 2016-A
TAOT 2017-A
TAOT 2018-A
5
9 13
2010, 2011, 2012 Series
TAOT 2010-B
TAOT 2010-C
TAOT 2012-A -----TAOT 2012-B
17 21 25
2016, 2017, 2018 Series
-TAOT 2016-B
-TAOT 2017-8
-TAOT 2018-8
TAOT 2016-C
-TACT 2017-C
TAOT 2018-C
17
33 37
21 25
29 33
37
41
******
Source: Company Reports as of January 15, 2021 payment date
41
TAOT 2011-A
45 49
TAOT 2016-D
-TAOT 2017-D
TAOT 2018-D
45 49
0.6%
0.5%
0,4%
0.2%
0.1%
0.0%
0.7%
0.6%
0.5%
0.3%
0.2%
0.1%
1
1
TAOT 2013-A
TAOT 2014-B
===--TAOT 2015-B
5 9
TAOT 2019-A
TAOT 2020-A
5
13
9
13
2013, 2014, 2015 Series
TAOT 2013-B
TAOT 2014-C
TAOT 2015-C
METURES
225
17
21
17
25
21
33
2019 and 2020 Series
-TAOT 2019-B ---TAOT 2019-C
-TAOT 2020-B
-TAOT 2020-C
29
37
TAOT 2014-A
TAOT 2015-A
=====
MARIA
41
41
45 49
0.6%
0.5%
0.4%
0.3%
0.2%
0.1%
0.0%
TAOT 2019-D 0.6%
-TAOT 2020-D
0.5%
0.4%
0.3%
0.2%
0.1%
0.0%
45 49
TOYOTA FINANCIAL SERVICES 31View entire presentation