Trian Partners Activist Presentation Deck
Illustrative Returns
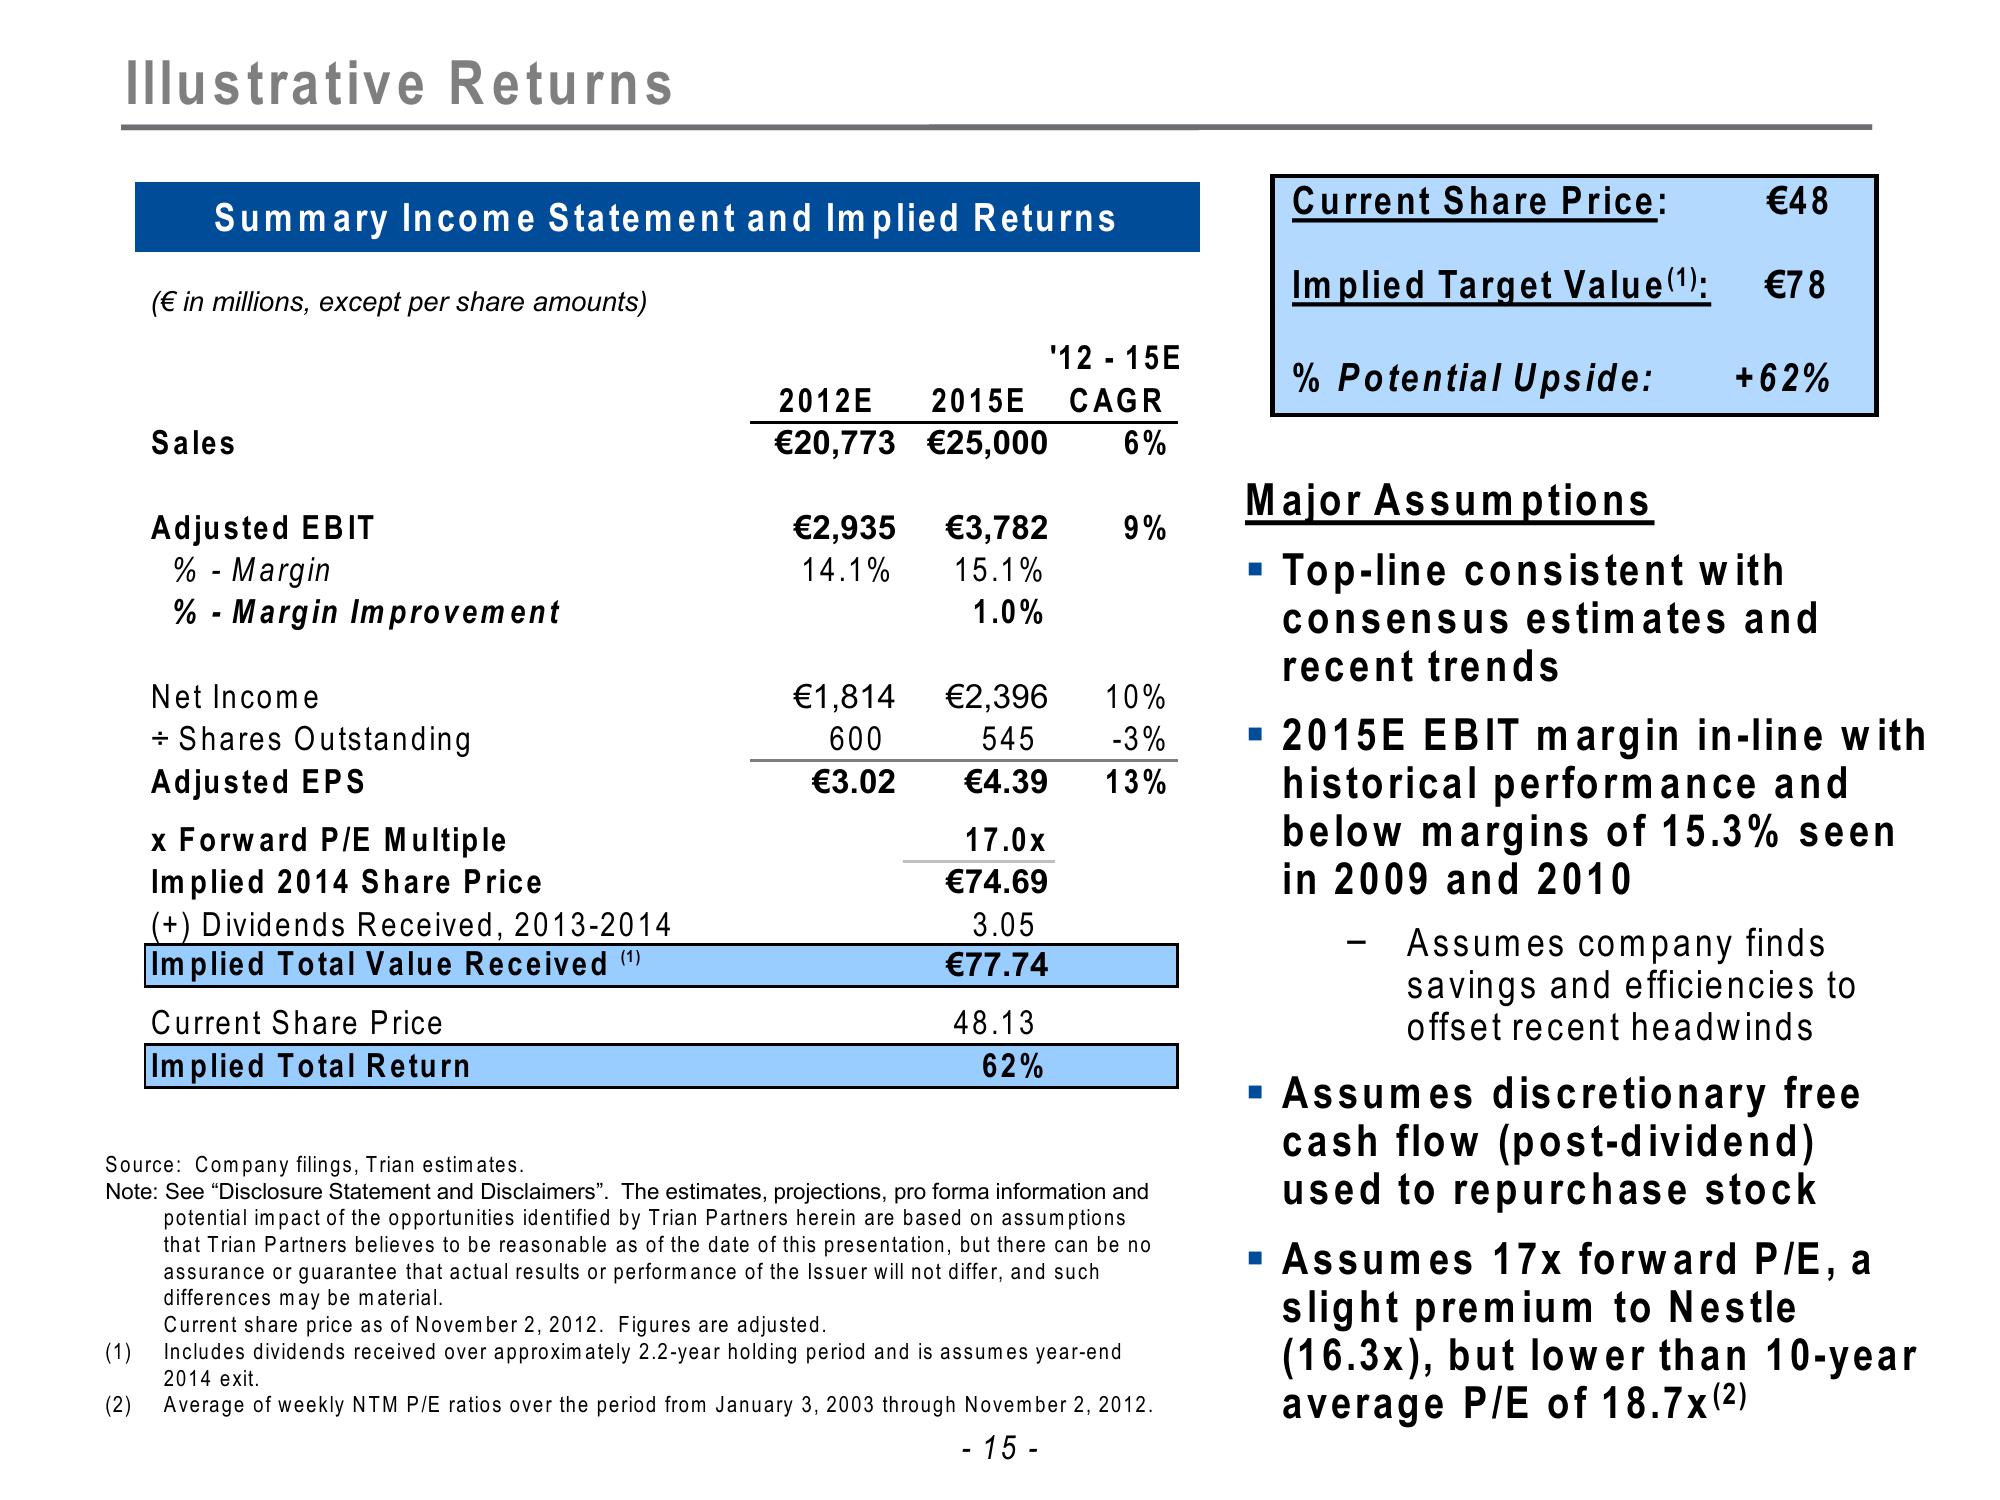
Summary Income Statement and Implied Returns
(€ in millions, except per share amounts)
Sales
Adjusted EBIT
% - Margin
%-Margin Improvement
Net Income
+ Shares Outstanding
Adjusted EPS
x Forward P/E Multiple
Implied 2014 Share Price
(+) Dividends Received, 2013-2014
Implied Total Value Received (¹)
Current Share Price
Implied Total Return
'12 - 15E
2012E 2015E CAGR
€20,773 €25,000 6%
€2,935 €3,782
14.1% 15.1%
1.0%
€1,814
600
€3.02
€2,396
545
€4.39
17.0x
€74.69
3.05
€77.74
48.13
62%
9%
10%
-3%
13%
Source: Company filings, Trian estimates.
Note: See "Disclosure Statement and Disclaimers". The estimates, projections, pro forma information and
potential impact of the opportunities identified by Trian Partners herein are based on assumptions
that Trian Partners believes to be reasonable as of the date of this presentation, but there can be no
assurance or guarantee that actual results or performance of the Issuer will not differ, and such
differences may be material.
Current share price as of November 2, 2012. Figures are adjusted.
(1) Includes dividends received over approximately 2.2-year holding period and is assumes year-end
2014 exit.
(2) Average of weekly NTM P/E ratios over the period from January 3, 2003 through November 2, 2012.
- 15-
Current Share Price:
Implied Target Value (¹):
% Potential Upside:
■
€48
€78
+62%
Major Assumptions
Top-line consistent with
consensus estimates and
recent trends
▪ 2015E EBIT margin in-line with
historical performance and
below margins of 15.3% seen
in 2009 and 2010
Assumes company finds
savings and efficiencies to
offset recent headwinds
▪ Assumes discretionary free
cash flow (post-dividend)
used to repurchase stock
a
▪ Assumes 17x forward P/E,
slight premium to Nestle
(16.3x), but lower than 10-year
average P/E of 18.7x (²)View entire presentation