Modeling with New Disclosures Linking Price & Drivers to Financial Results
Mosaic Fertilizantes finished product production.
I
I
■
I
■
■
■
■
1.30
1.20
1.10
1.00
0.90
0.80
0.70
0.60
Mosaic refers to this portion of Mosaic Fertilizantes as the B2B business
The costs in this business are primarily BRL based, with 20% in USD related to raw materials of sulfur and ammonia. As a result, the segment is short BRL for
months longer than 3 months. Approximately 50% of this exposure is hedged, with the unrealized gain / loss on these hedges flowing through the corporate
segment.
Once the finished product is priced, with pricing generally tied to the USD price of the global product, the production and distribution businesses combined are
actually long BRL in the short term, and the company hedges netcash proceeds into USD.
In 2020, the business had approximately R$4 billion in costs subject to local currency inflation, with reported 2020 IPCA inflation (the best proxy) at 4.5%.
Mosaic Fertilizantes produces several phosphates products that generally trade relative to MAP prices. General ratios are: TSP = 80% MAP; SSP = 40% MAP
Mosaic Fertilizantes also sells other products like animal feed, phosphoric acid, sulfuric acid and sulfur, as well as co products like gypsum.
Our disclosures include produced volumes, which are typically recognized as sales on a one quarter lag.
Only MAP uses ammonia, so the ammonia volumes used in production are significantly less than Mosaic's Florida phosphate operation.
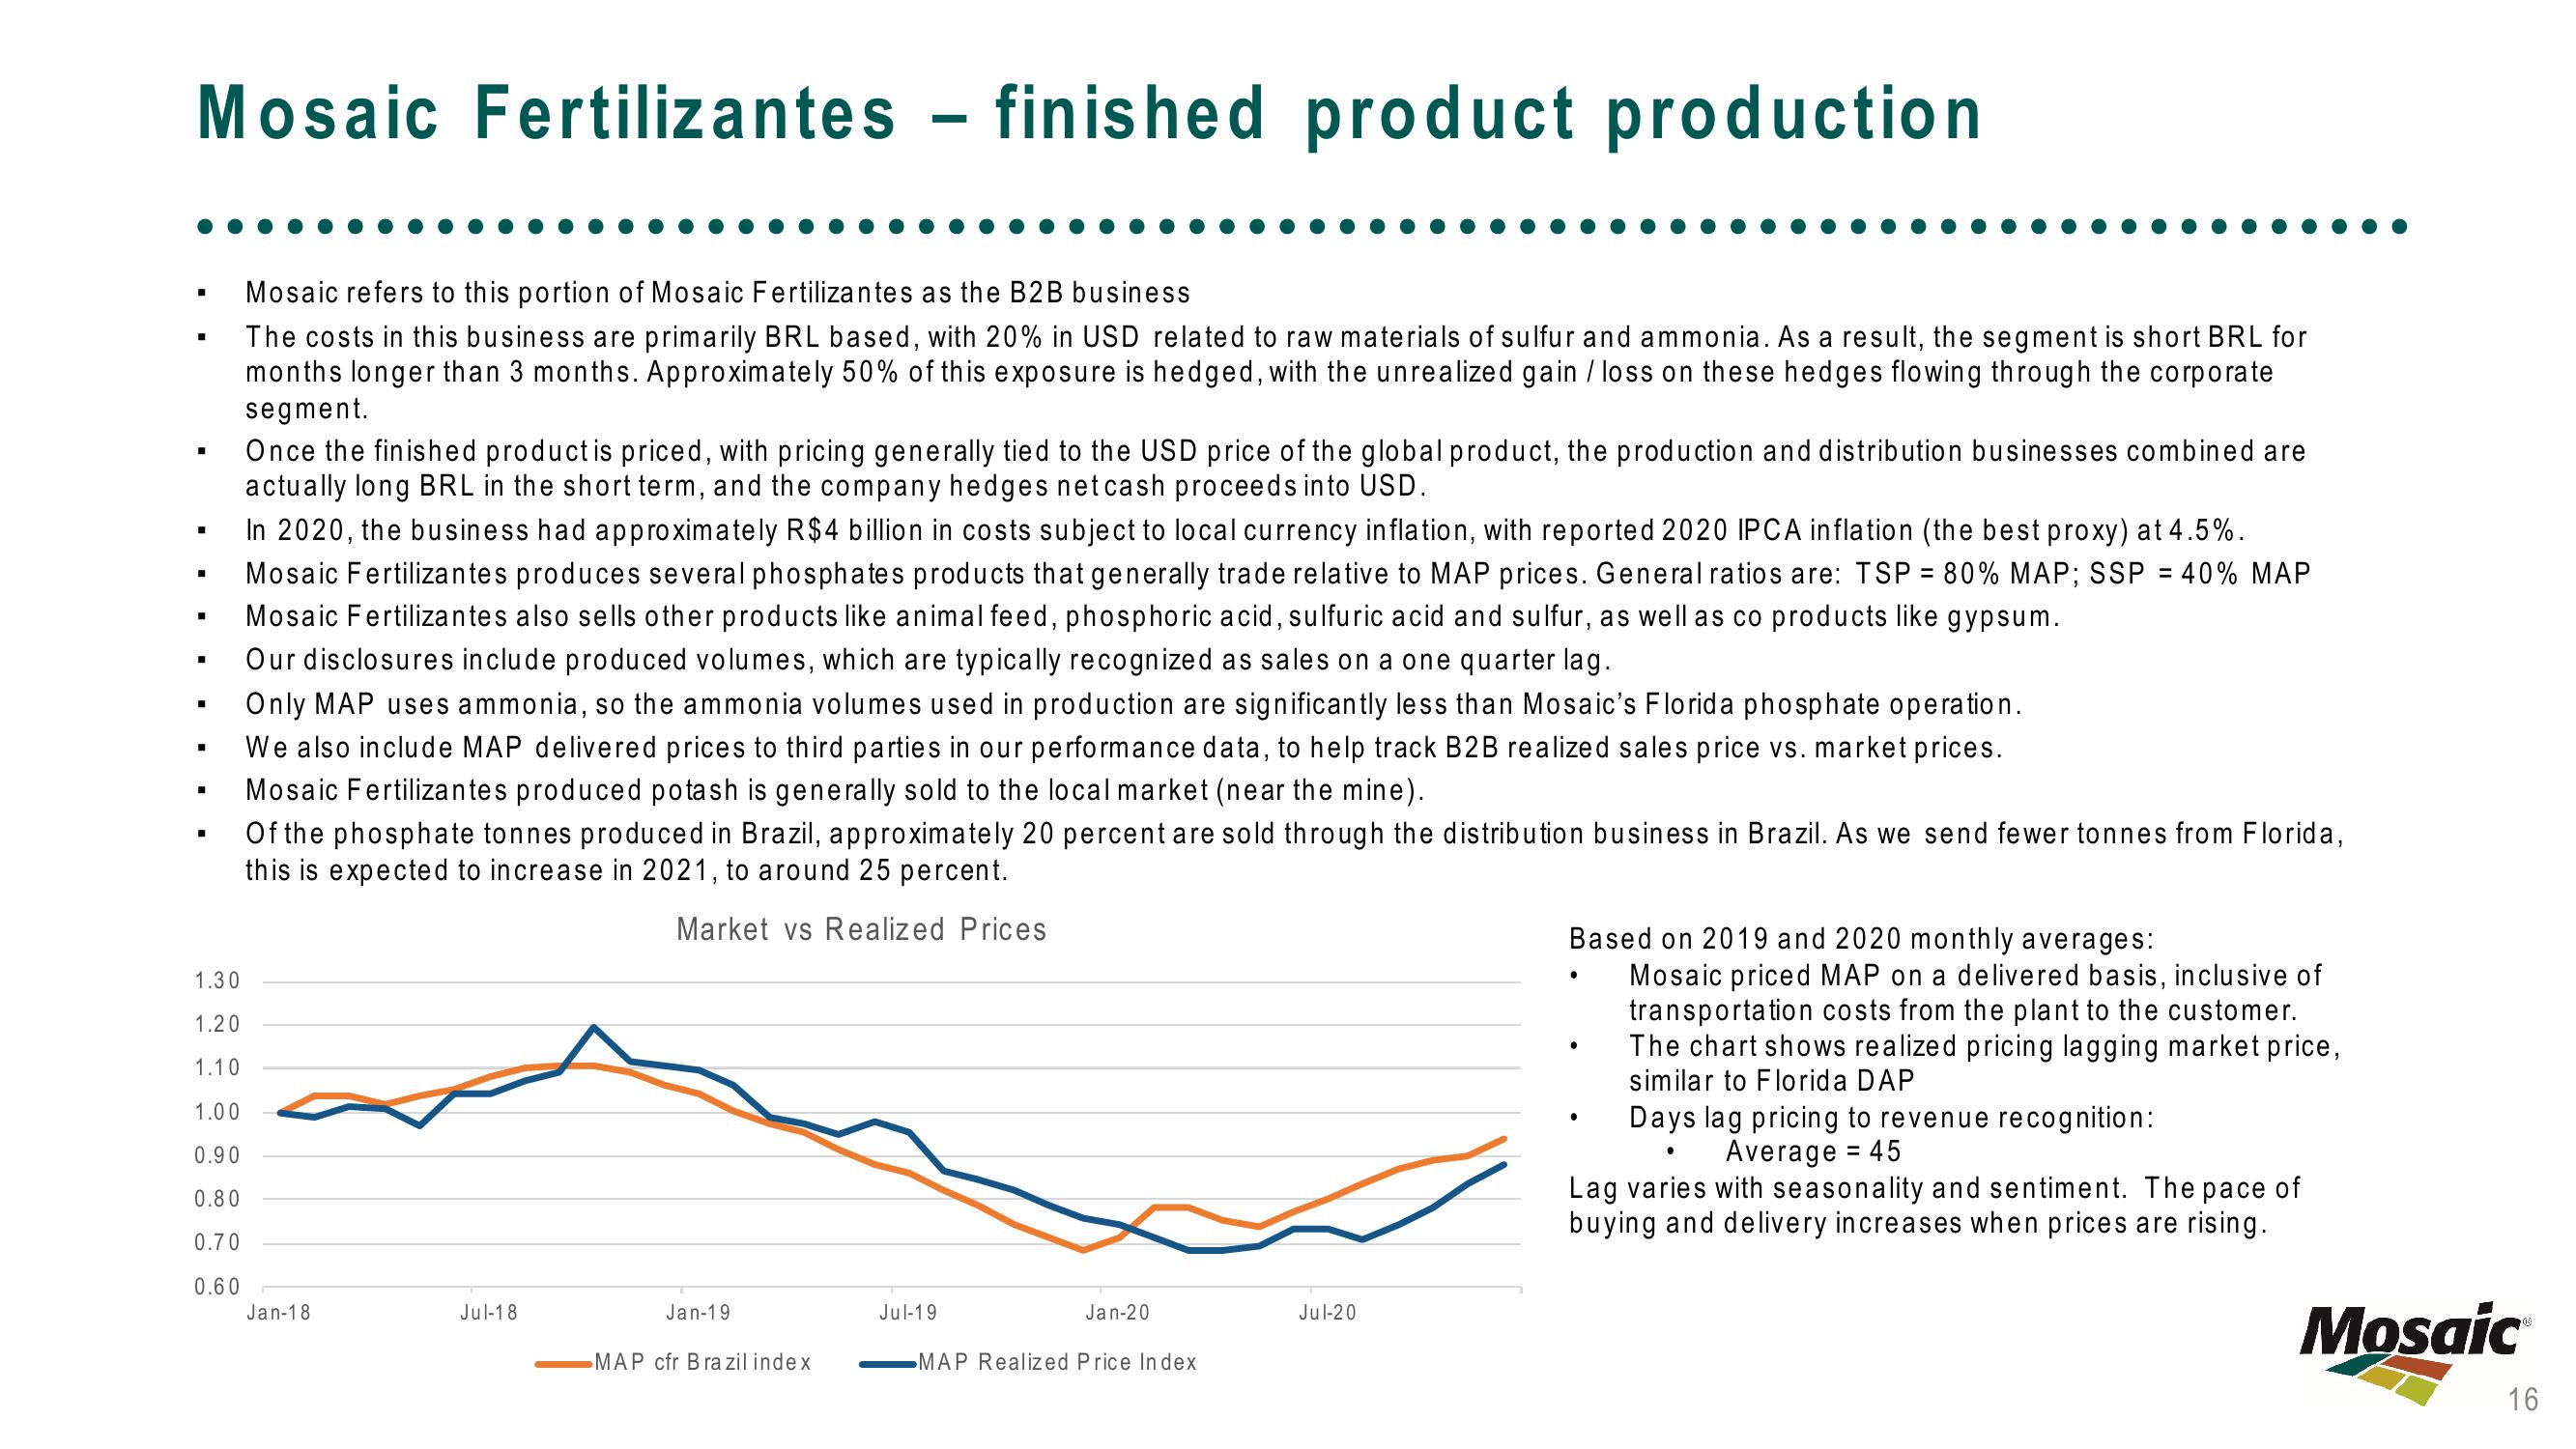
We also include MAP delivered prices to third parties in our performance data, to help track B2B realized sales price vs. market prices.
Mosaic Fertilizantes produced potash is generally sold to the local market (near the mine).
Of the phosphate tonnes produced in Brazil, approximately 20 percent are sold through the distribution business in Brazil. As we send fewer tonnes from Florida,
this is expected to increase in 2021, to around 25 percent.
Market vs Realized Prices
Jan-18
Jul-18
-
Jan-19
MAP cfr Brazil index
Jul-19
Jan-20
MAP Realized Price Index
Jul-20
Based on 2019 and 2020 monthly averages:
Mosaic priced MAP on a delivered basis, inclusive of
transportation costs from the plant to the customer.
The chart shows realized pricing lagging market price,
similar to Florida DAP
Days lag pricing to revenue recognition:
Average = 45
Lag varies with seasonality and sentiment. The pace of
buying and delivery increases when prices are rising.
Mosaic
16View entire presentation