Vivid Seats Results Presentation Deck
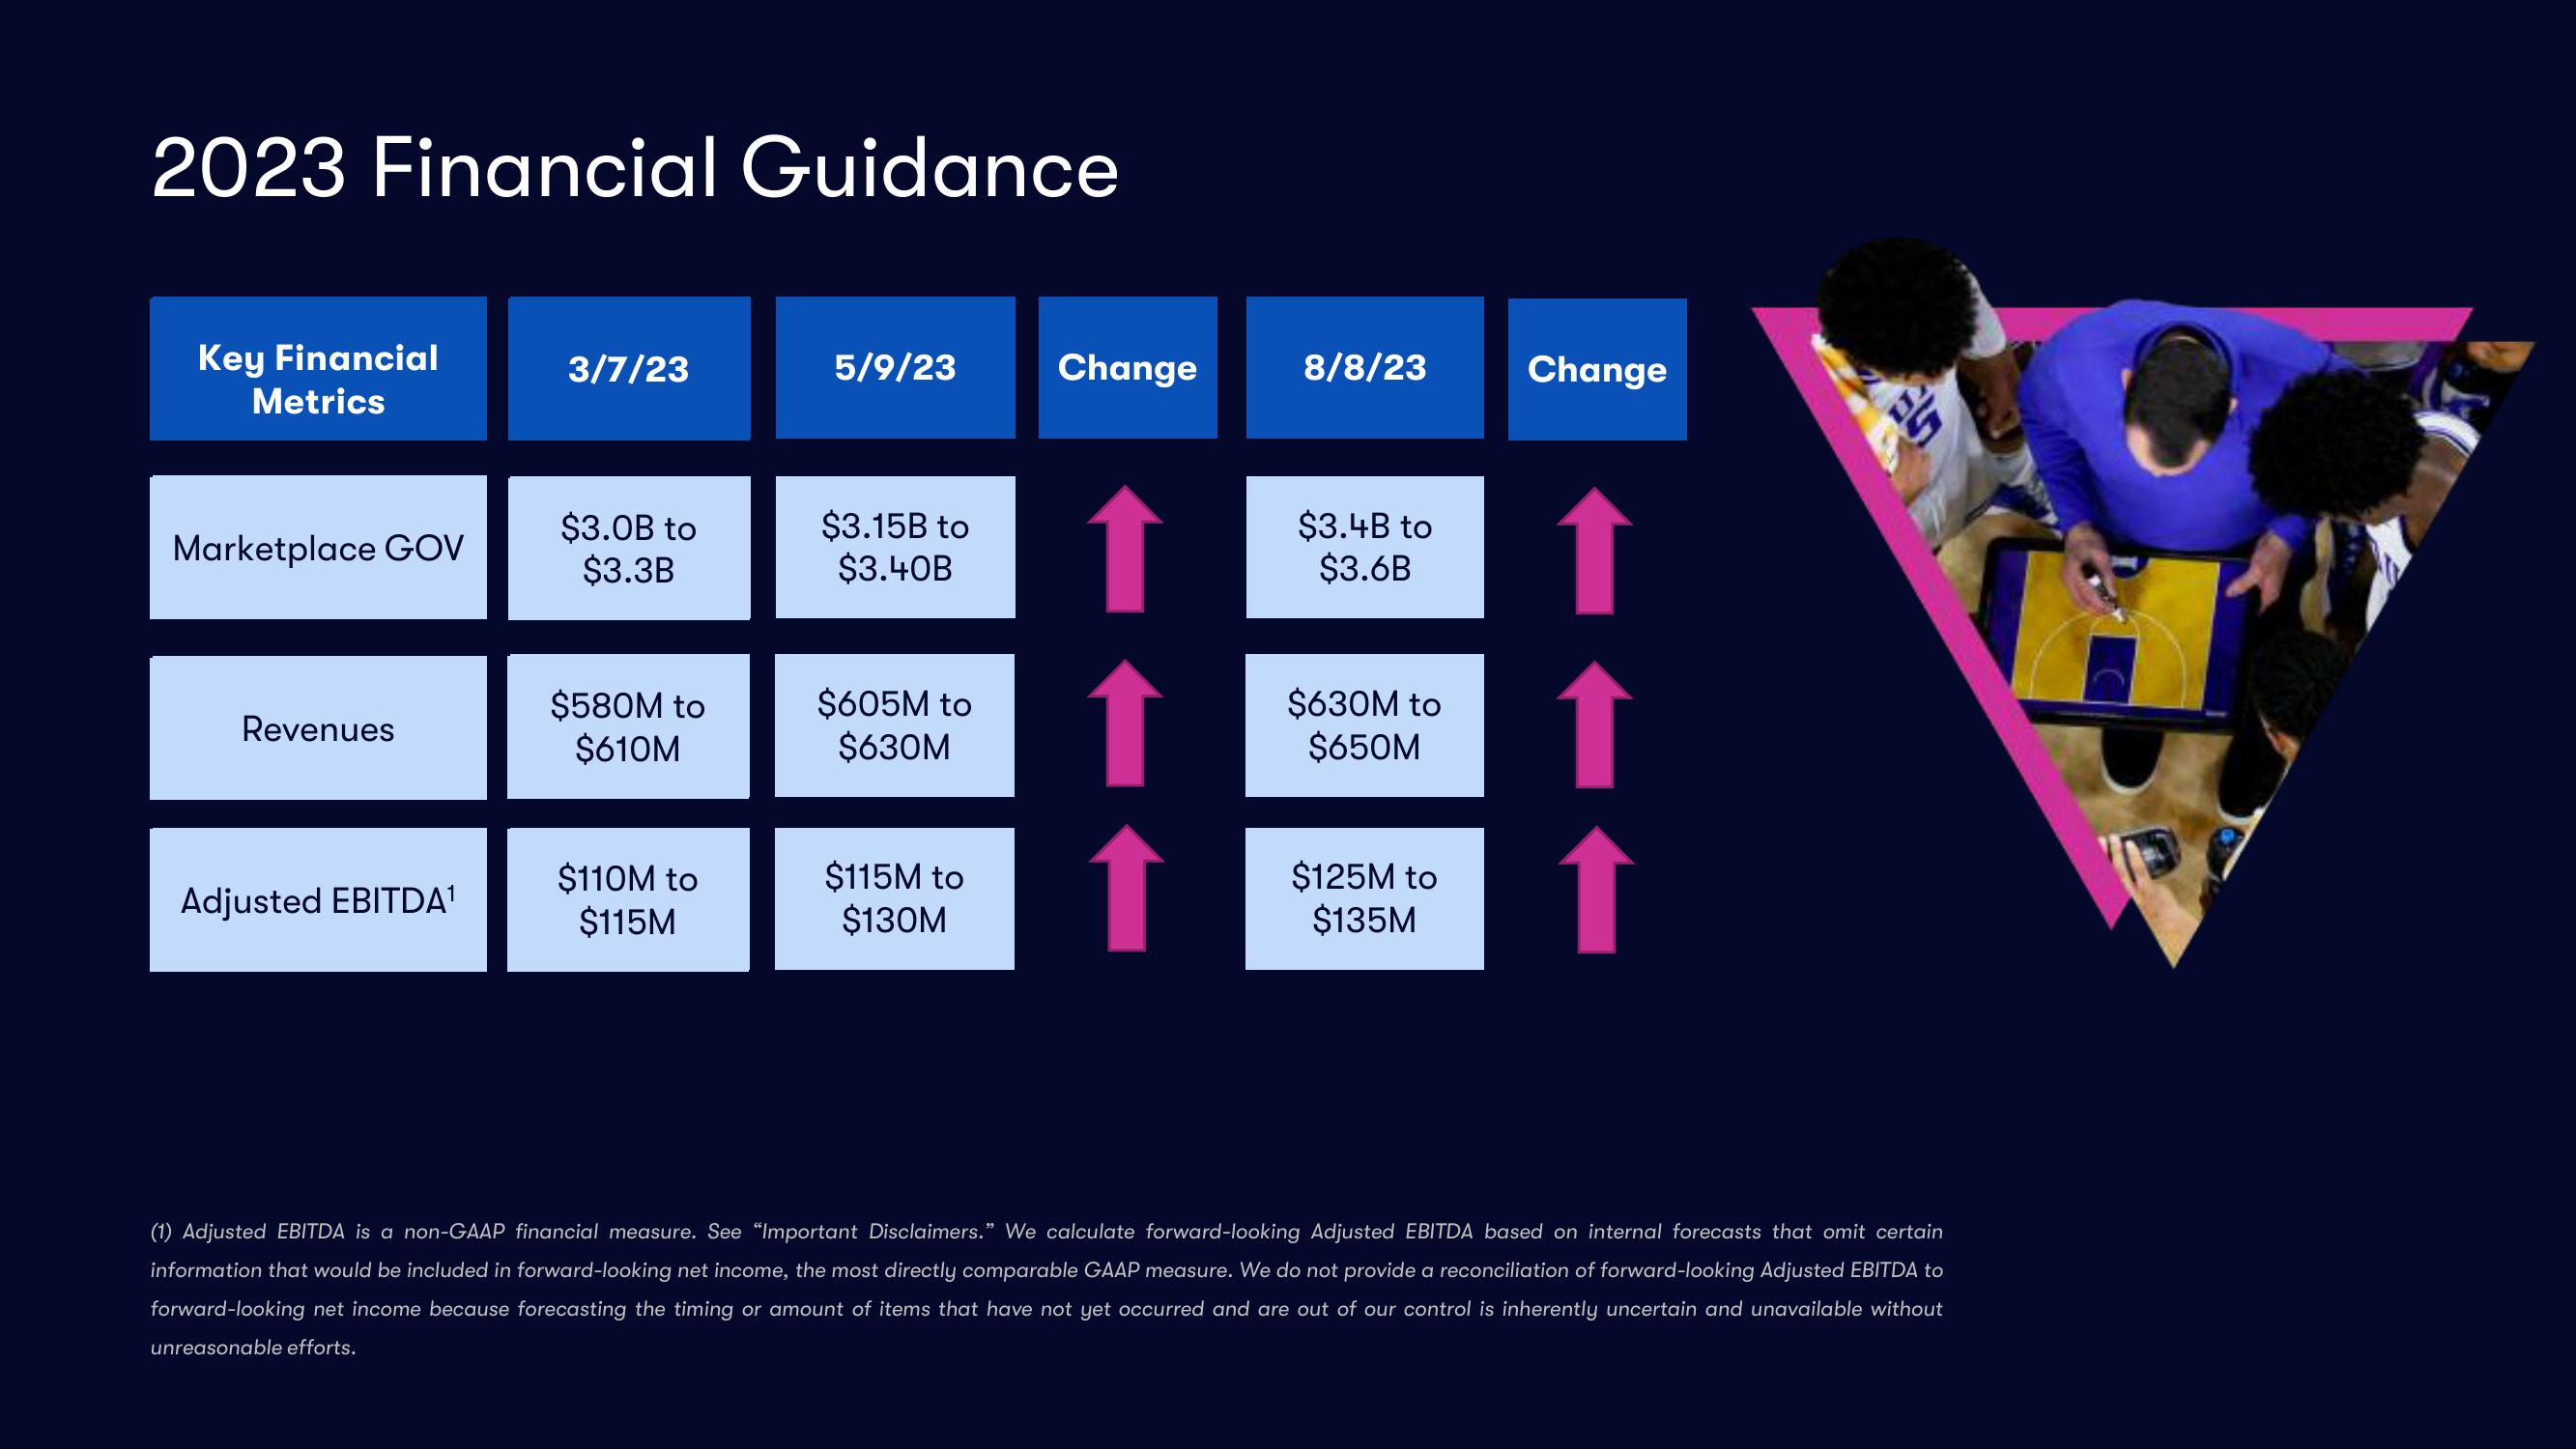
2023 Financial Guidance
Key Financial
Metrics
Marketplace GOV
Revenues
Adjusted EBITDA¹
3/7/23
$3.0B to
$3.3B
$580M to
$610M
$110M to
$115M
5/9/23
$3.15B to
$3.40B
$605M to
$630M
$115M to
$130M
Change
↑
↑
↑
8/8/23
$3.4B to
$3.6B
$630M to
$650M
$125M to
$135M
Change
↑
↑
↑
SLO
(1) Adjusted EBITDA is a non-GAAP financial measure. See "Important Disclaimers." We calculate forward-looking Adjusted EBITDA based on internal forecasts that omit certain
information that would be included in forward-looking net income, the most directly comparable GAAP measure. We do not provide a reconciliation of forward-looking Adjusted EBITDA to
forward-looking net income because forecasting the timing or amount of items that have not yet occurred and are out of our control is inherently uncertain and unavailable without
unreasonable efforts.View entire presentation