Summit Hotel Properties Investor Presentation Deck
11
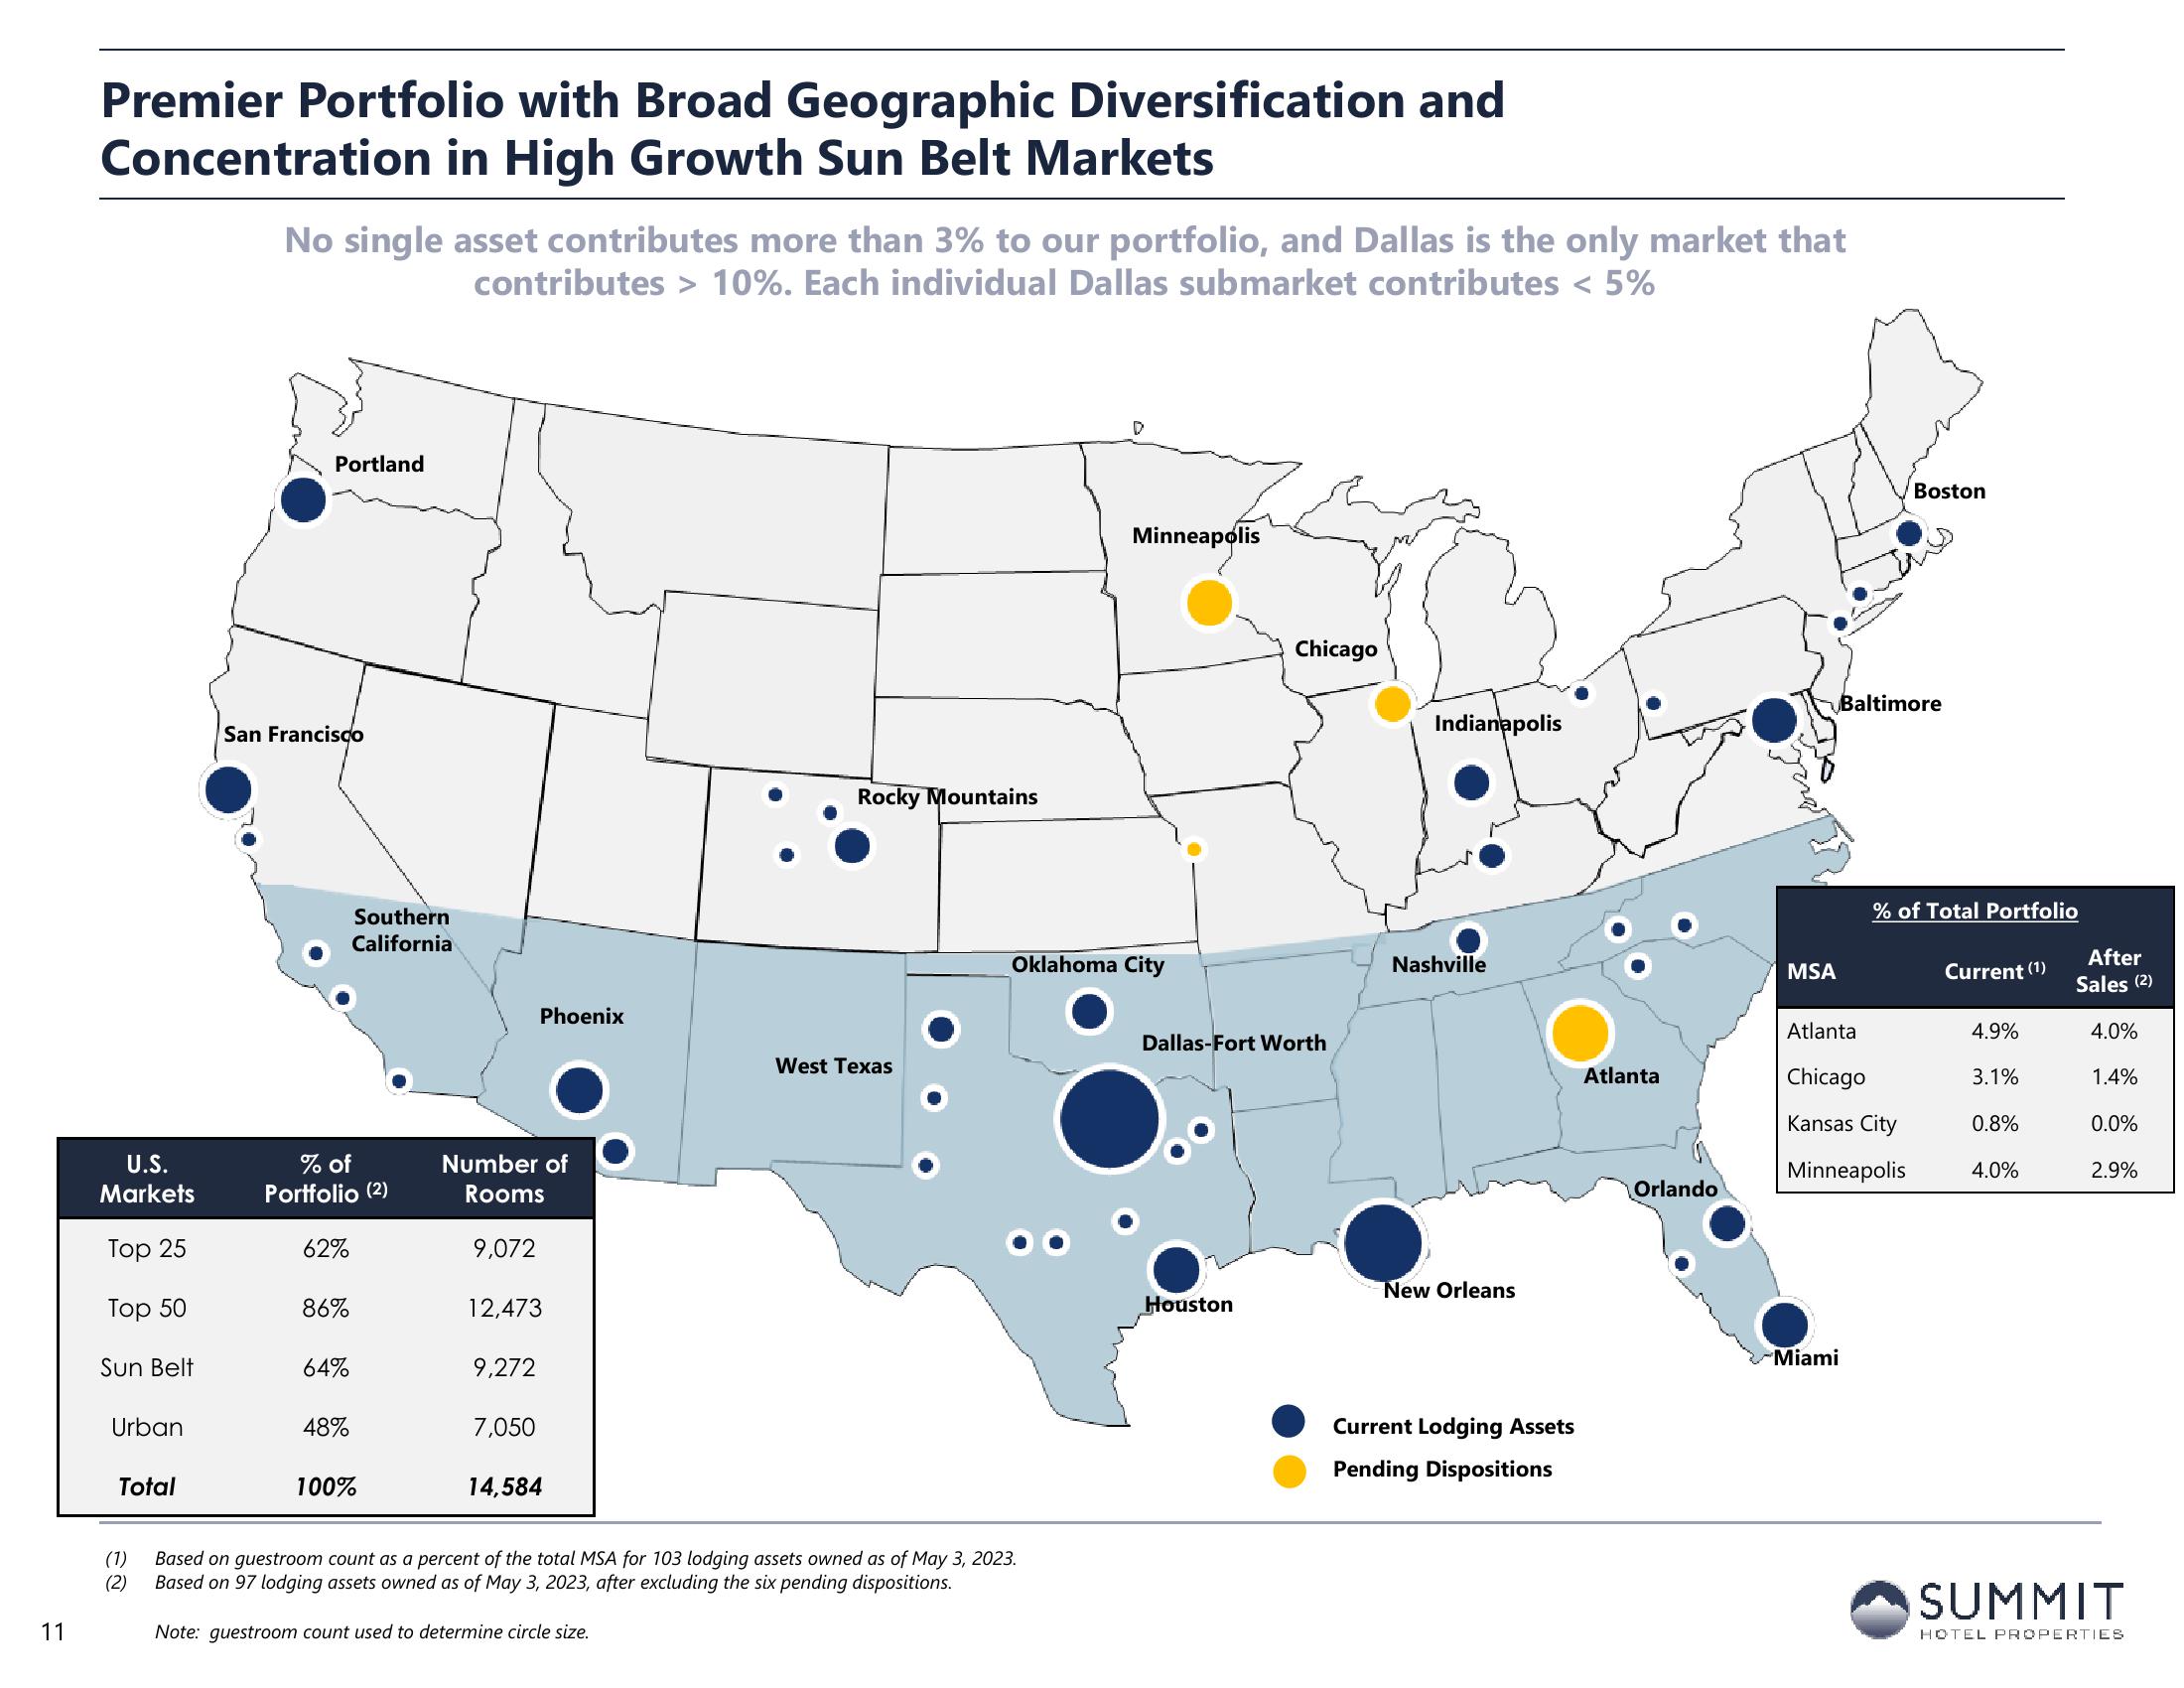
Premier Portfolio with Broad Geographic Diversification and
Concentration in High Growth Sun Belt Markets
U.S.
Markets
Top 25
Top 50
Sun Belt
Urban
Total
No single asset contributes more than 3% to our portfolio, and Dallas is the only market that
contributes > 10%. Each individual Dallas submarket contributes < 5%
Portland
San Francisco
% of
Portfolio (2)
62%
86%
64%
Southern
California
48%
100%
Number of
Rooms
9,072
Phoenix
12,473
9,272
7,050
14,584
Rocky Mountains
West Texas
D
(1)
Based on guestroom count as a percent of the total MSA for 103 lodging assets owned as of May 3, 2023.
(2) Based on 97 lodging assets owned as of May 3, 2023, after excluding the six pending dispositions.
Note: guestroom count used to determine circle size.
Minneapolis
Oklahoma City
Chicago
Dallas-Fort Worth
Houston
Indianapolis
Nashville
New Orleans
Current Lodging Assets
Pending Dispositions
Atlanta
Orlando
MSA
Baltimore
Atlanta
Boston
Chicago
Kansas City
Minneapolis
Miami
% of Total Portfolio
Current (1)
4.9%
3.1%
0.8%
4.0%
After
Sales (2)
4.0%
1.4%
0.0%
2.9%
SUMMIT
HOTEL PROPERTIESView entire presentation