DigitalOcean Results Presentation Deck
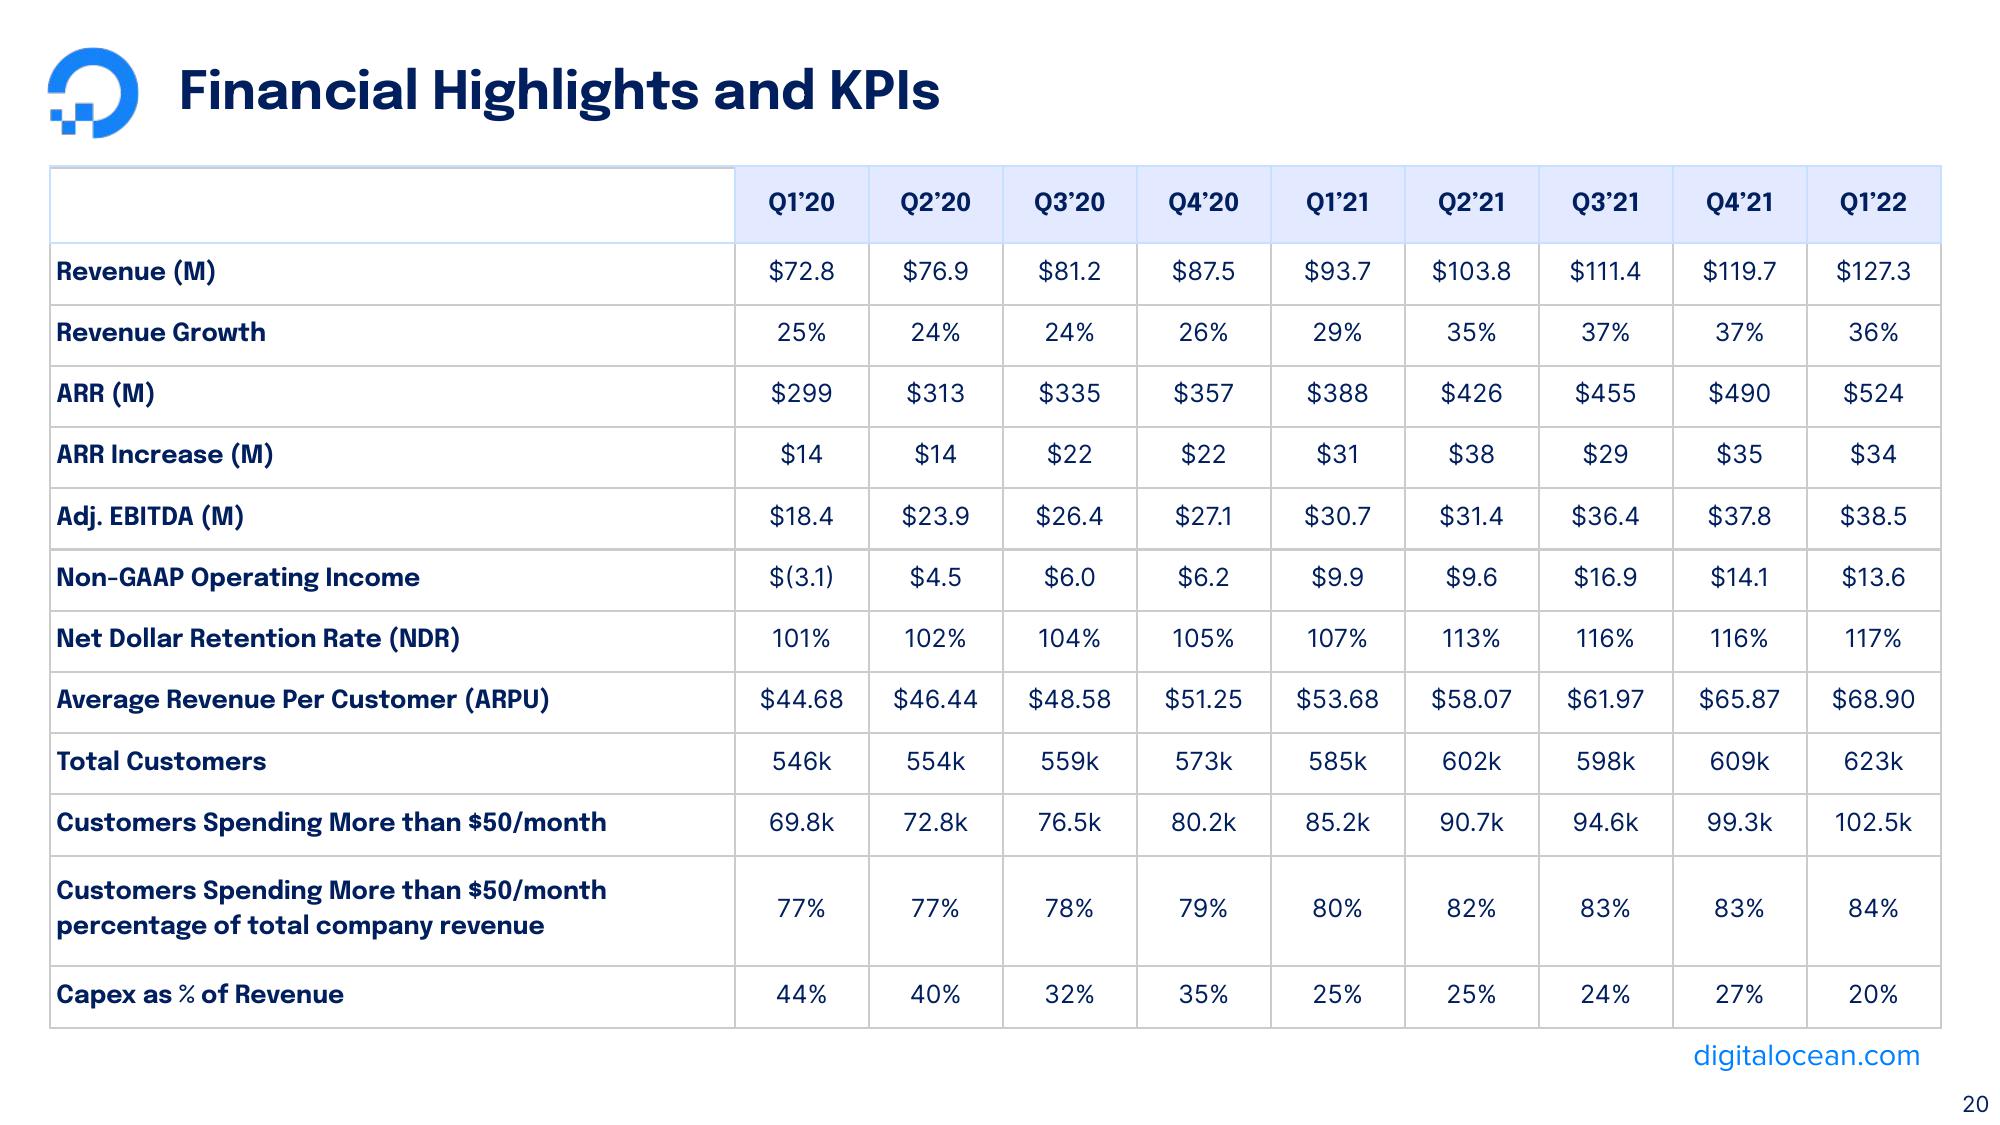
→ Financial Highlights and KPIs
Revenue (M)
Revenue Growth
ARR (M)
ARR Increase (M)
Adj. EBITDA (M)
Non-GAAP Operating Income
Net Dollar Retention Rate (NDR)
Average Revenue Per Customer (ARPU)
Total Customers
Customers Spending More than $50/month
Customers Spending More than $50/month
percentage of total company revenue
Capex as % of Revenue
Q1'20
$72.8
25%
$299
$14
$18.4
$(3.1)
101%
$44.68
546k
69.8k
77%
44%
Q2'20 Q3'20
$76.9
24%
$313
$14
$23.9
$4.5
102%
554k
72.8k
77%
$81.2
40%
24%
$46.44 $48.58
$335
$22
$26.4
$6.0
104%
559k
76.5k
78%
32%
Q4'20 Q1'21 Q2'21 Q3'21 Q4'21 Q1'22
$87.5
26%
$357
$22
$27.1
$6.2
105%
$51.25
573k
80.2k
79%
35%
$93.7
29%
$388
$31
$30.7
$9.9
107%
$53.68
585k
85.2k
80%
25%
$103.8
35%
$426
$38
$31.4
$9.6
113%
$58.07
602k
90.7k
82%
25%
$111.4
37%
$455
$29
$36.4
$16.9
116%
$61.97
598k
94.6k
83%
24%
$119.7
37%
$490
$35
$37.8
$14.1
116%
$65.87
609k
99.3k
83%
27%
$127.3
36%
$524
$34
$38.5
$13.6
117%
$68.90
623k
102.5k
84%
20%
digitalocean.com
20View entire presentation