PJT Partners Investment Banking Pitch Book
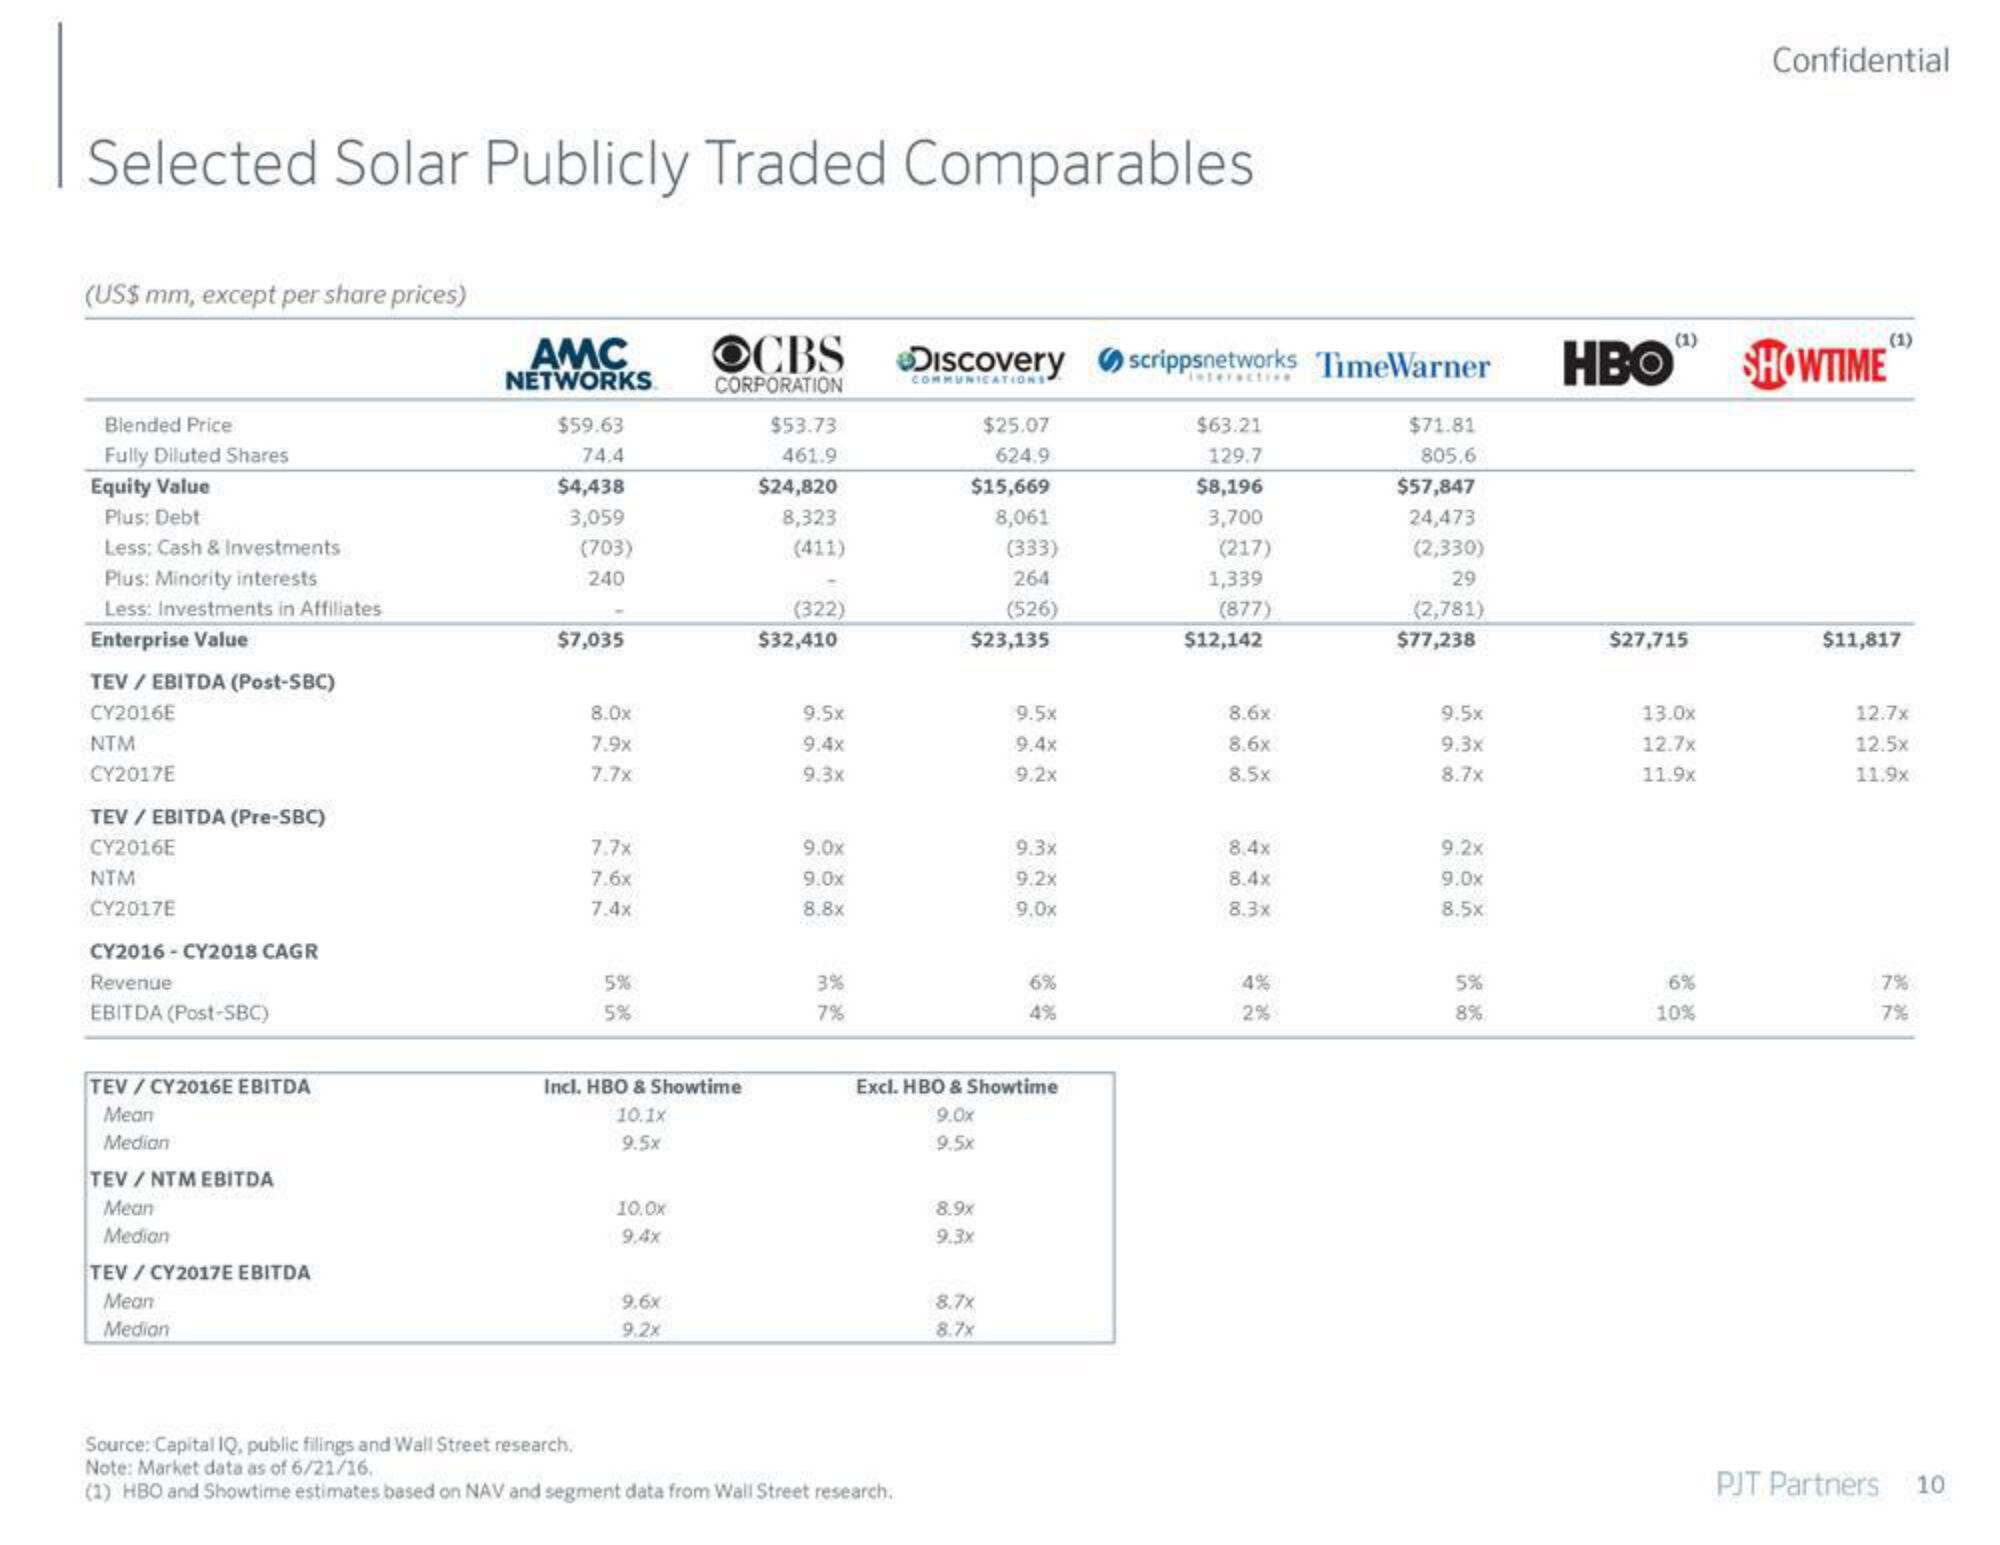
Selected Solar Publicly Traded Comparables
(US$ mm, except per share prices)
Blended Price
Fully Diluted Shares
Equity Value
Plus: Debt
Less: Cash & Investments
Plus: Minority interests
Less: Investments in Affiliates
Enterprise Value
TEV / EBITDA (Post-SBC)
CY2016E
NTM
CY2017E
TEV / EBITDA (Pre-SBC)
CY2016E
NTM
CY2017E
CY2016 CY2018 CAGR
Revenue
EBITDA (Post-SBC)
TEV/CY2016E EBITDA
Mean
Median
TEV / NTM EBITDA
Mean
Median
TEV / CY 2017E EBITDA
Mean
Median
AMC
NETWORKS
$59.63
74.4
$4,438
3,059
(703)
240
$7,035
8.0x
7.9x
7.7x
7.7x
7.6x
7.4x
5%
5%
Incl. HBO & Showtime
10.1x
9.5x
10.0x
9.4x
OCBS Discovery
CORPORATION
COMMUNICATIONS
9.6x
9.2x
$53.73
461.9
$24,820
8,323
(411)
(322)
$32,410
9.5x
9.4x
9.3x
9.0x
9.0x
8.8x
3%
7%
$25.07
624.9
$15,669
Source: Capital IQ, public filings and Wall Street research.
Note: Market data as of 6/21/16.
(1) HBO and Showtime estimates based on NAV and segment data from Wall Street research.
8,061
$23,135
8.9x
9.3x
(333)
264
(526)
8.7x
8.7x
9.5x
9.4x
9.2x
Excl. HBO & Showtime
9.0x
9.5x
9.3x
9.2x
9.0x
6%
4%
scrippsnetworks TimeWarner HBO
$63.21
129.7
$8,196
3,700
(217)
1,339
(877)
$12,142
8.6x
8.6x
8.5x
8.4x
8.4x
8.3x
2%
$71.81
805.6
$57,847
24,473
(2,330)
29
(2,781)
$77,238
9.5x
9.3x
8.7x
9.2x
9.0x
8.5x
5%
8%
(1)
$27,715
13.0x
12.7x
11.9x
6%
10%
Confidential
(1)
SHOWTIME
$11,817
12.7x
12.5x
11.9x
7%
PJT Partners
10View entire presentation