Pershing Square Activist Presentation Deck slide image

Pershing Square Activist Presentation Deck

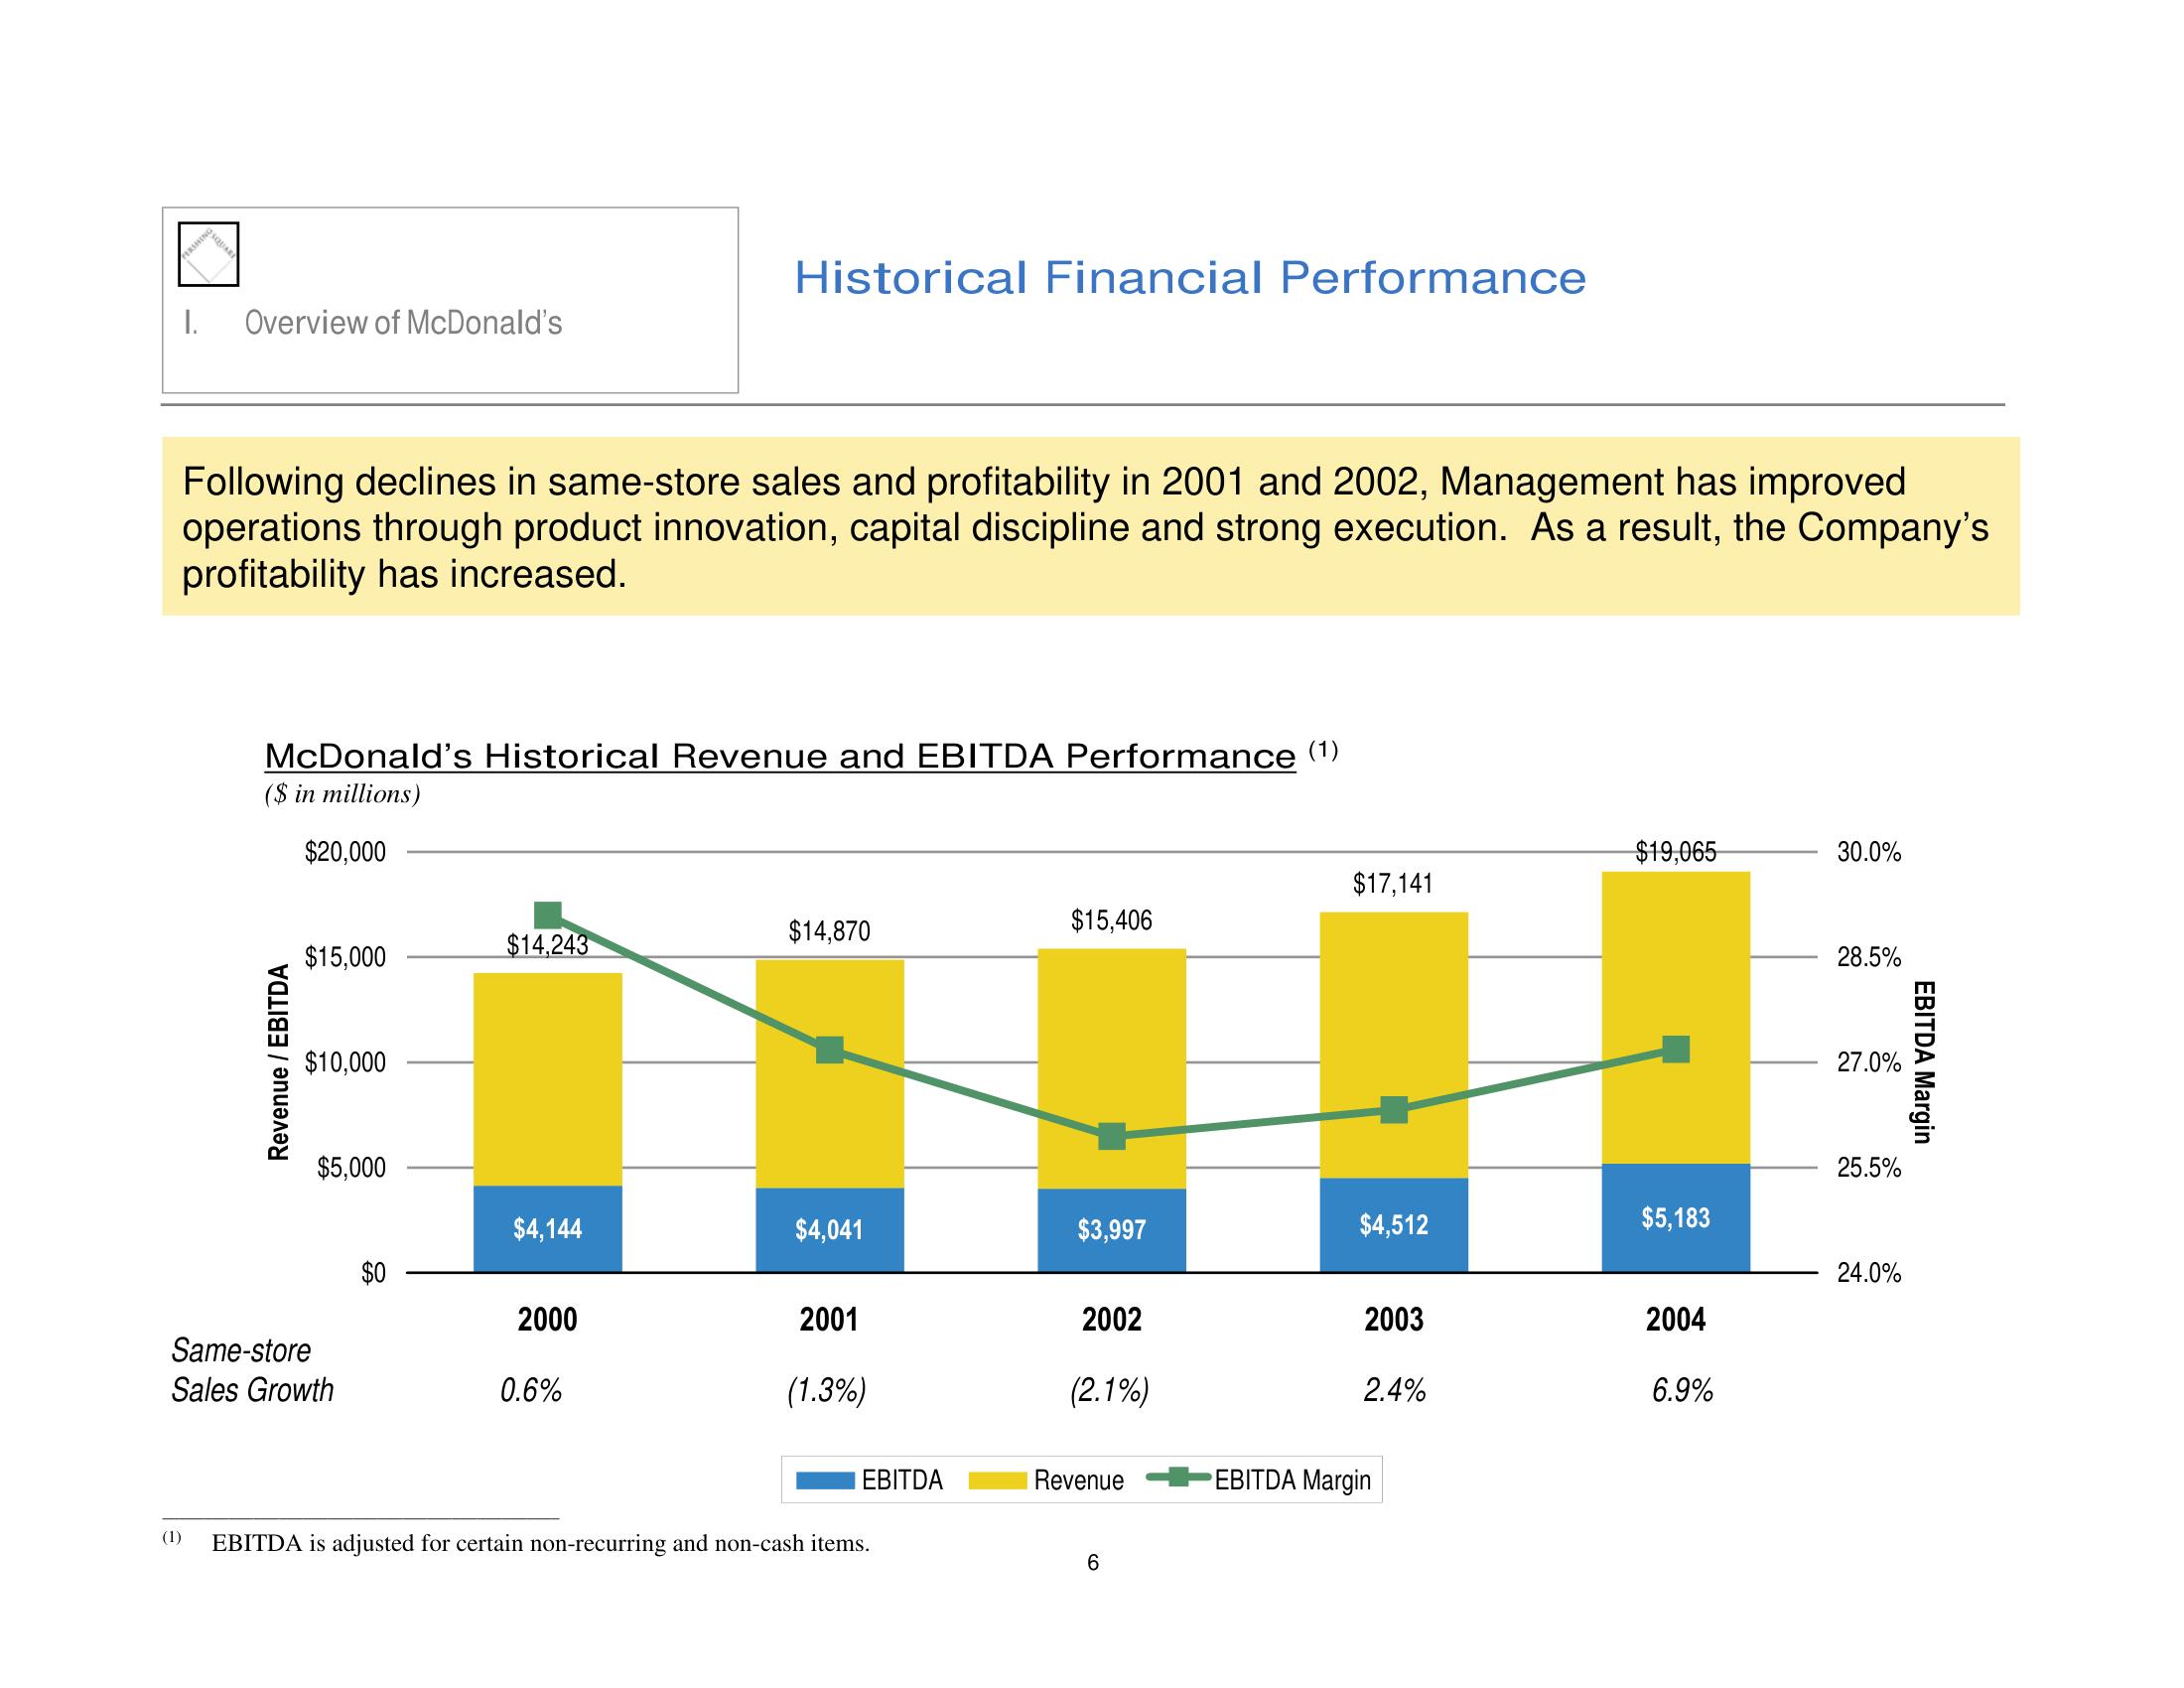
I. Overview of McDonald's Following declines in same-store sales and profitability in 2001 and 2002, Management has improved operations through product innovation, capital discipline and strong execution. As a result, the Company's profitability has increased. McDonald's Historical Revenue and EBITDA Performance (1) ($ in millions) $20,000 Revenue / EBITDA $15,000 $10,000 $5,000 Same-store Sales Growth $0 $14,243 $4,144 Historical Financial Performance 2000 0.6% $14,870 $4,041 2001 (1.3%) EBITDA (1) EBITDA is adjusted for certain non-recurring and non-cash items. $15,406 $3,997 2002 (2.1%) Revenue 6 $17,141 $4,512 2003 2.4% EBITDA Margin $19,065 $5,183 2004 6.9% 30.0% 28.5% 27.0% 25.5% 24.0% EBITDA Margin
View entire presentation