Forbes SPAC Presentation Deck
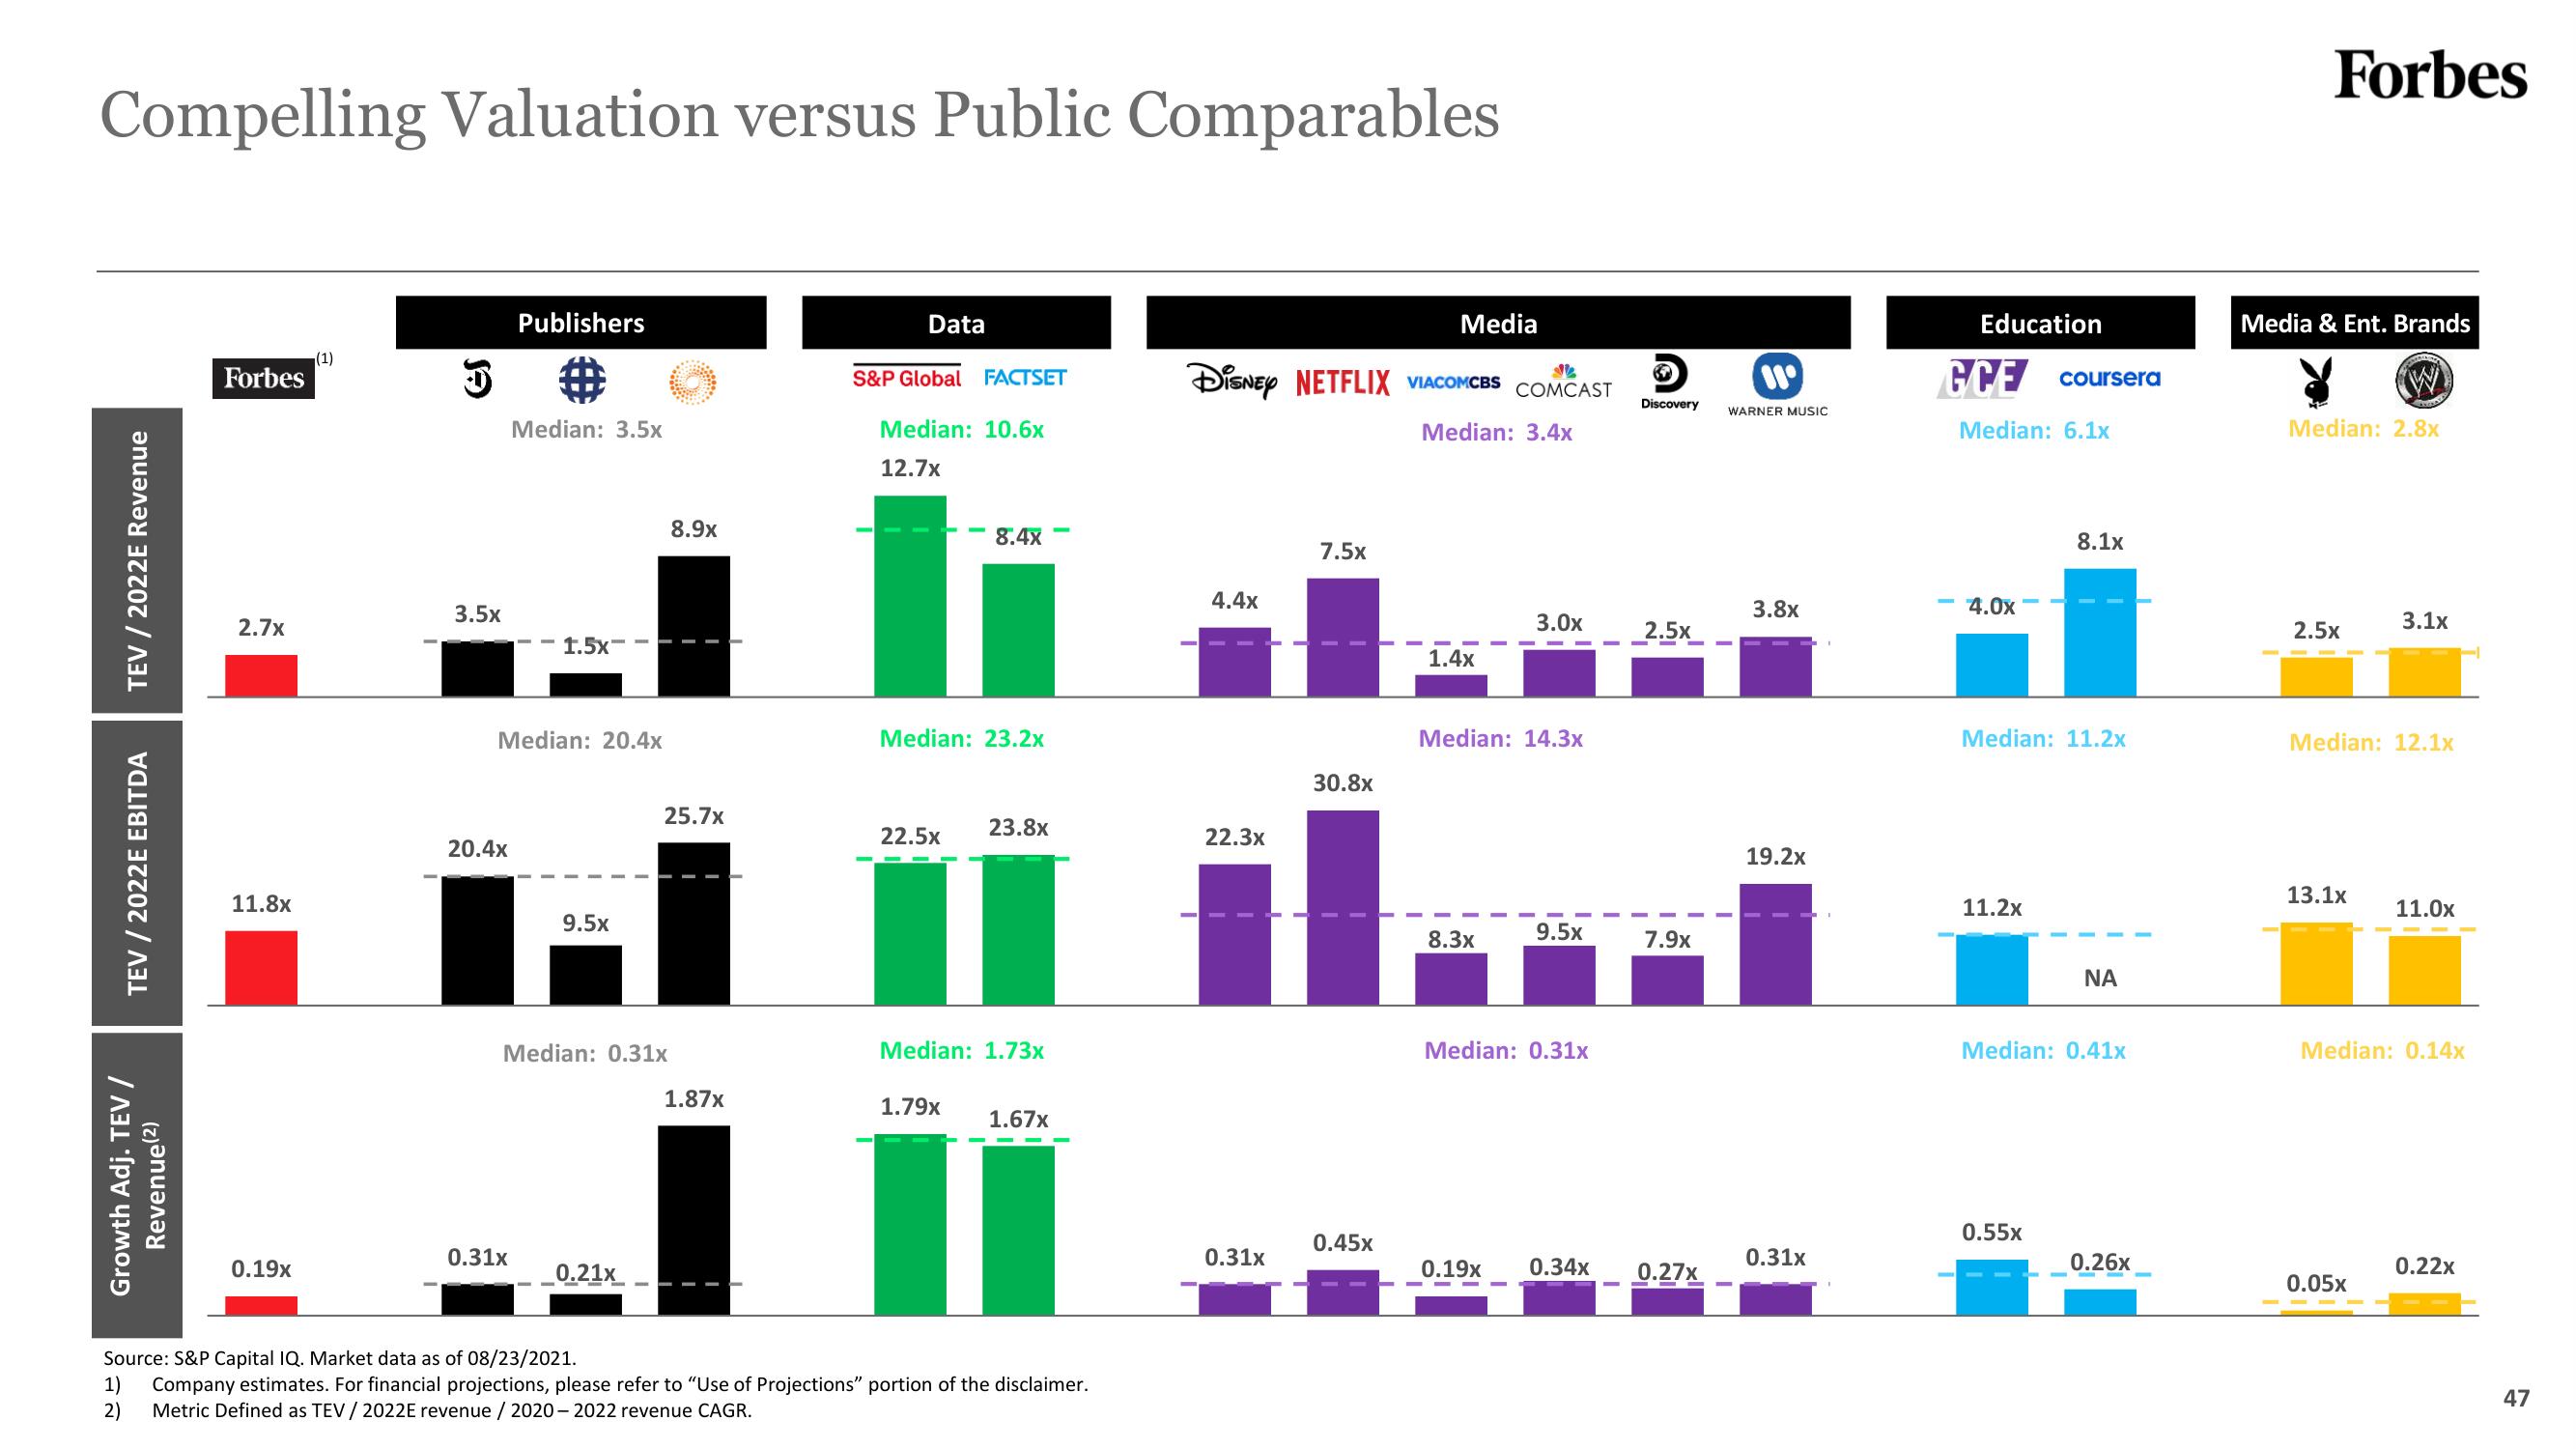
Compelling Valuation versus Public Comparables
TEV / 2022E Revenue
TEV / 2022E EBITDA
Growth Adj. TEV /
Revenue (2)
Forbes
2.7x
11.8x
0.19x
(1)
J
3.5x
20.4x
Publishers
#
0.31x
Median: 3.5x
Median: 20.4x
1.5x= =
9.5x
Median: 0.31x
0.21x
8.9x
25.7x
1.87x
Data
S&P Global FACTSET
Median: 10.6x
12.7x
Median: 23.2x
22.5x
8.4x
1.79x
23.8x
Median: 1.73x
1.67x
Source: S&P Capital IQ. Market data as of 08/23/2021.
1) Company estimates. For financial projections, please refer to "Use of Projections" portion of the disclaimer.
2)
Metric Defined as TEV / 2022E revenue/2020-2022 revenue CAGR.
DISNEY NETFLIX VIACOMCBS
4.4x
22.3x
0.31x
7.5x
30.8x
0.45x
Media
-
Median: 3.4x
1.4x
COMCAST
8.3x
3.0x
Median: 14.3x
9.5x
Median: 0.31x
0.19x 0.34x
4
Discovery
2.5x
7.9x
0.27x
WARNER MUSIC
3.8x
19.2x
0.31x
Education
GCE coursera
Median: 6.1x
4.0x
Median: 11.2x
11.2x
8.1x
0.55x
NA
Median: 0.41x
0.26x
Forbes
Media & Ent. Brands
Median: 2.8x
2.5x
AMAND
13.1x
Median: 12.1x
3.1x
0.05x
11.0x
Median: 0.14x
0.22x
47View entire presentation