KKR Real Estate Finance Trust Results Presentation Deck
1Q'20 KREF Loan Portfolio
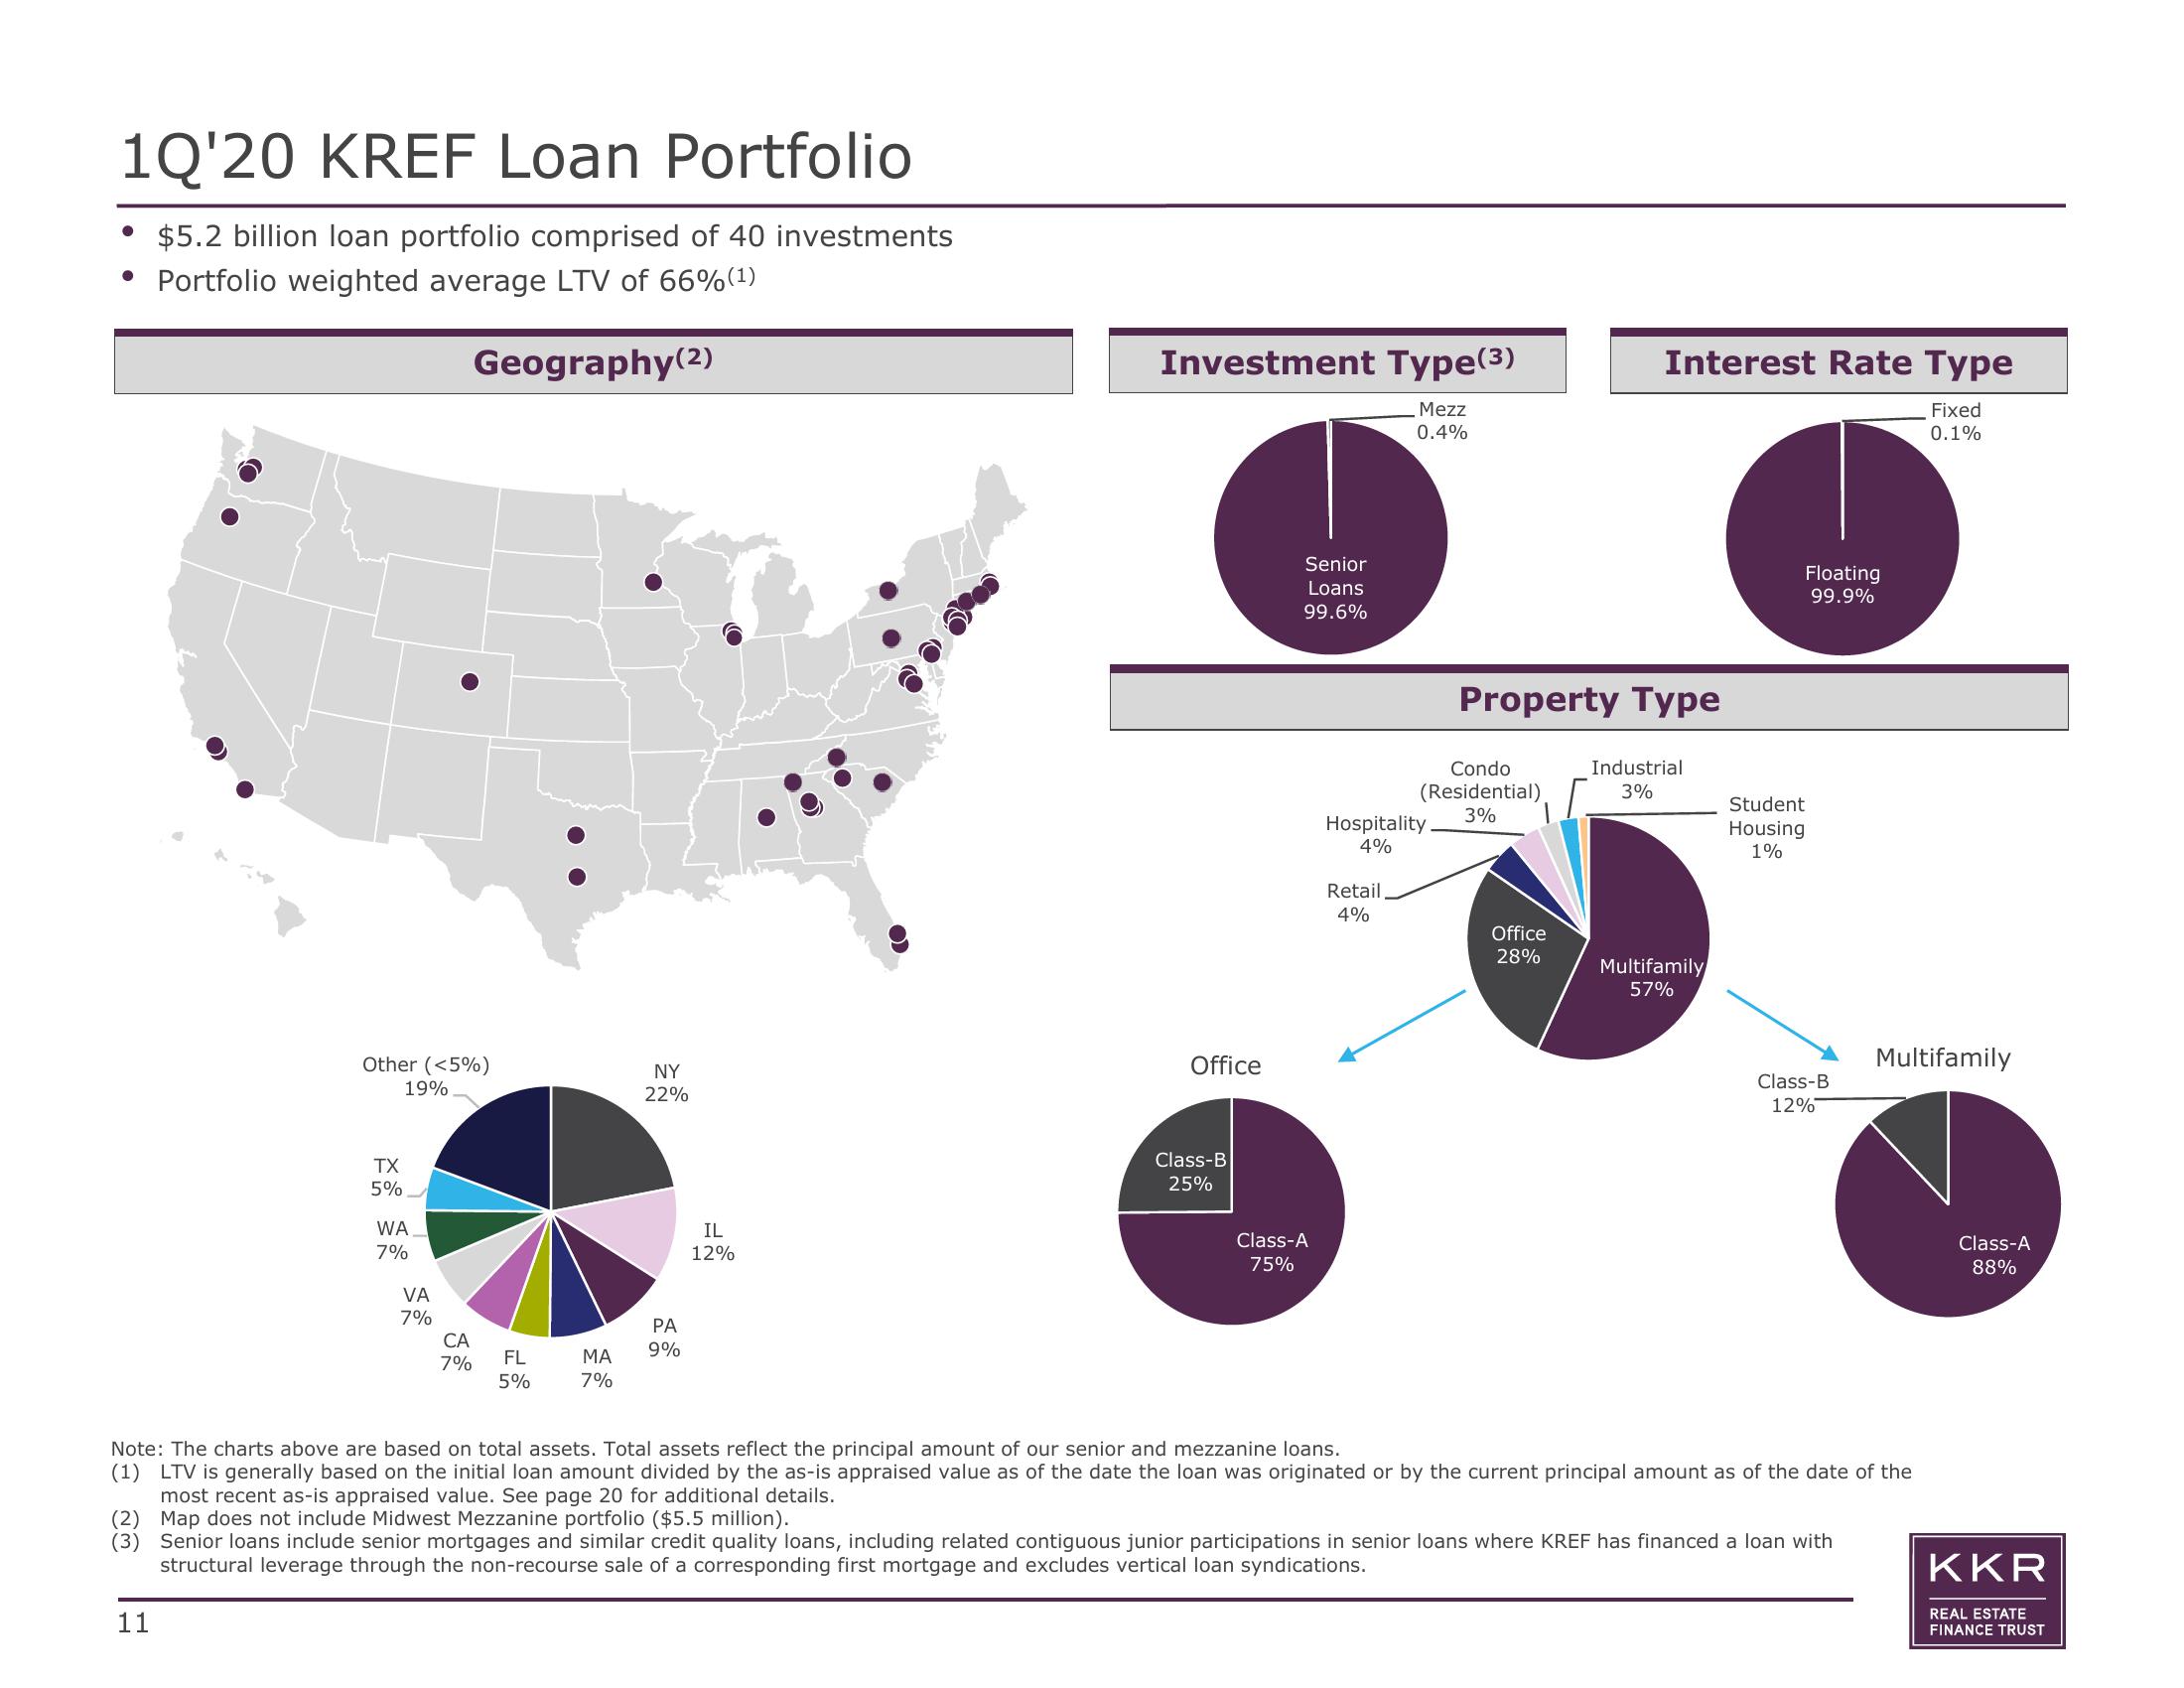
$5.2 billion loan portfolio comprised of 40 investments
• Portfolio weighted average LTV of 66% (¹)
Geography (2)
Other (<5%)
19%
11
TX
5%
WA
7%
VA
7%
CA
7%
FL
5%
MA
7%
NY
22%
PA
9%
IL
12%
Investment Type(³)
Mezz
0.4%
Office
Class-B
25%
Senior
Loans
99.6%
Class-A
75%
Hospitality
4%
Retail
4%
Condo
(Residential)
3%
Property Type
Industrial
3%
Interest Rate Type
Fixed
0.1%
Office
28%
Multifamily
57%
Floating
99.9%
Student
Housing
1%
Class-B
12%
Multifamily
Note: The charts above are based on total assets. Total assets reflect the principal amount of our senior and mezzanine loans.
(1) LTV is generally based on the initial loan amount divided by the as-is appraised value as of the date the loan was originated or by the current principal amount as of the date of the
most recent as-is appraised value. See page 20 for additional details.
(2) Map does not include Midwest Mezzanine portfolio ($5.5 million).
(3) Senior loans include senior mortgages and similar credit quality loans, including related contiguous junior participations in senior loans where KREF has financed a loan with
structural leverage through the non-recourse sale of a corresponding first mortgage and excludes vertical loan syndications.
Class-A
88%
KKR
REAL ESTATE
FINANCE TRUSTView entire presentation