Opendoor SPAC Presentation Deck
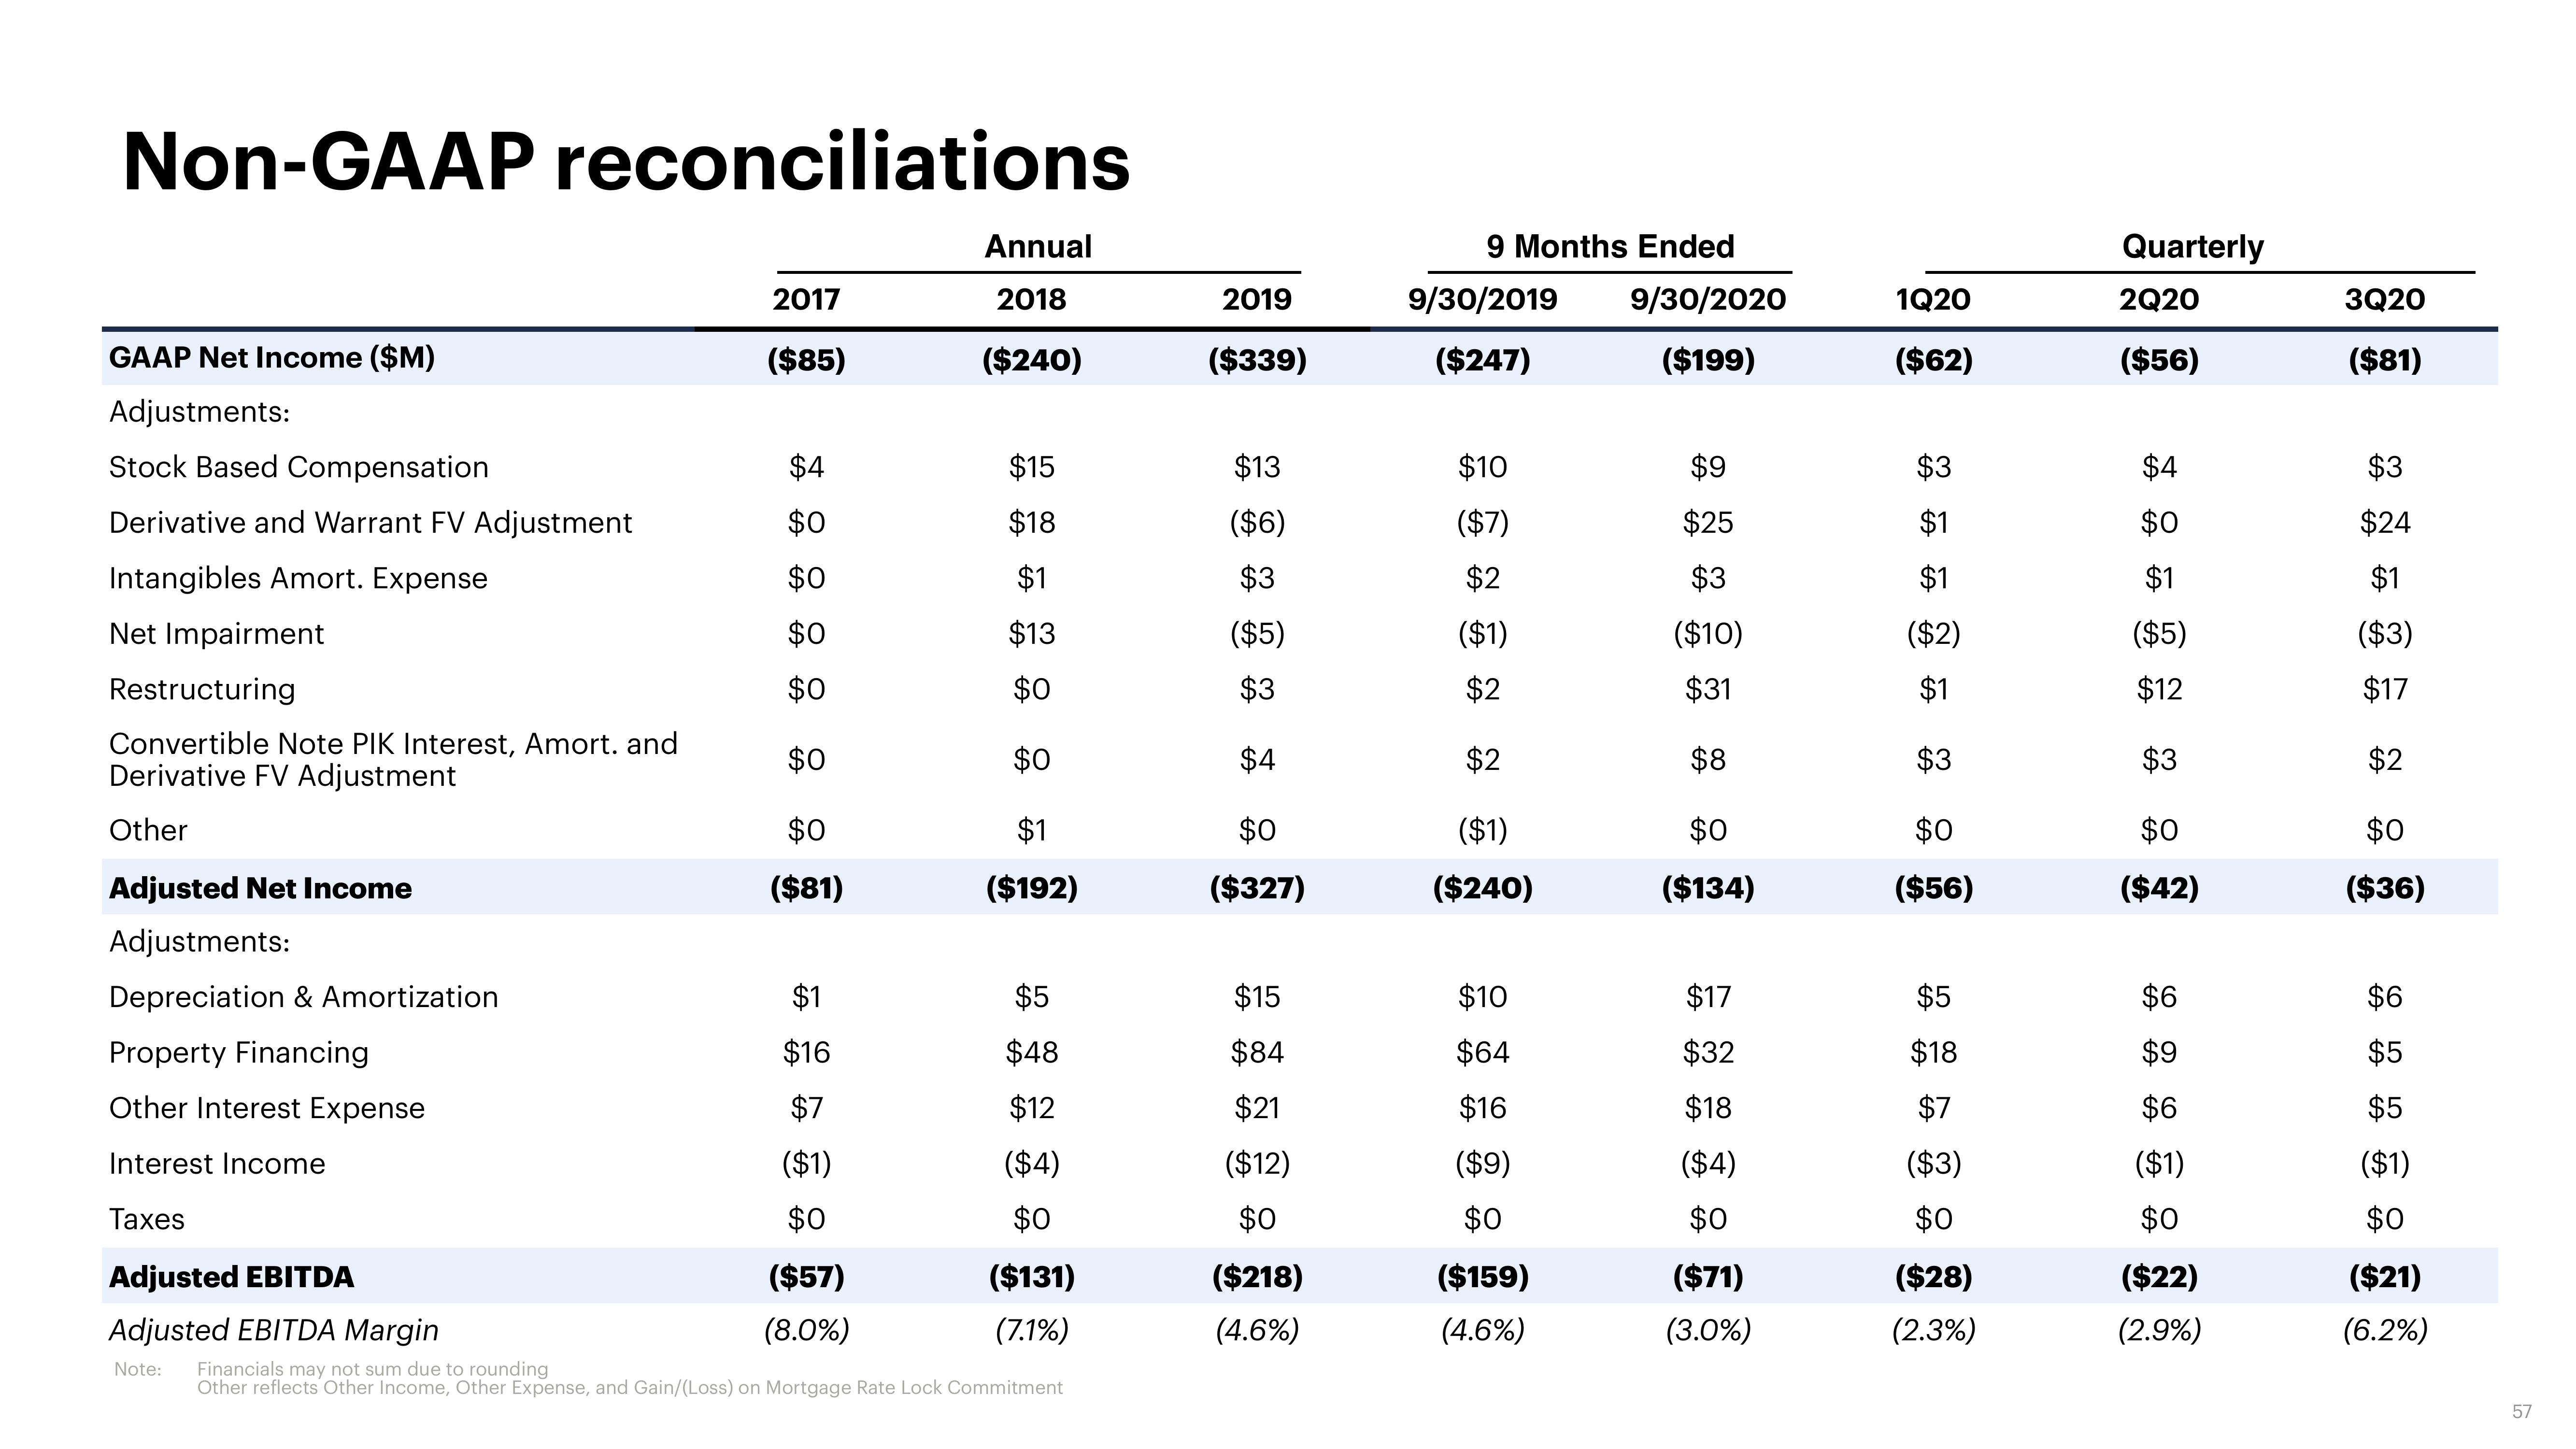
Non-GAAP reconciliations
GAAP Net Income ($M)
Adjustments:
Stock Based Compensation
Derivative and Warrant FV Adjustment
Intangibles Amort. Expense
Net Impairment
Restructuring
Convertible Note PIK Interest, Amort. and
Derivative FV Adjustment
Other
Adjusted Net Income
Adjustments:
Depreciation & Amortization
Property Financing
Other Interest Expense
Interest Income
Taxes
2017
($85)
$4
$0
$0
$0
$0
$0
$0
($81)
$1
$16
$7
($1)
$0
($57)
(8.0%)
Annual
2018
($240)
$15
$18
$1
$13
$0
$0
$1
($192)
$5
$48
$12
($4)
$0
Adjusted EBITDA
Adjusted EBITDA Margin
Note: Financials may not sum due to rounding
Other reflects Other Income, Other Expense, and Gain/(Loss) on Mortgage Rate Lock Commitment
($131)
(7.1%)
2019
($339)
$13
($6)
$3
($5)
$3
$4
$0
($327)
$15
$84
$21
($12)
$0
($218)
(4.6%)
9 Months Ended
9/30/2019 9/30/2020
($199)
($247)
$10
($7)
$2
($1)
$2
$2
($1)
($240)
$10
$64
$16
($9)
$0
($159)
(4.6%)
$9
$25
$3
($10)
$31
$8
$0
($134)
$17
$32
$18
($4)
$0
($71)
(3.0%)
1Q20
($62)
$3
$1
$1
($2)
$1
$3
$0
($56)
$5
$18
$7
($3)
$0
($28)
(2.3%)
Quarterly
2Q20
($56)
$4
$0
$1
($5)
$12
$3
$0
($42)
$6
$9
$6
($1)
$0
($22)
(2.9%)
3Q20
($81)
$3
$24
$1
($3)
$17
$2
$0
($36)
$6
$5
$5
($1)
$0
($21)
(6.2%)
57View entire presentation