Embark SPAC Presentation Deck
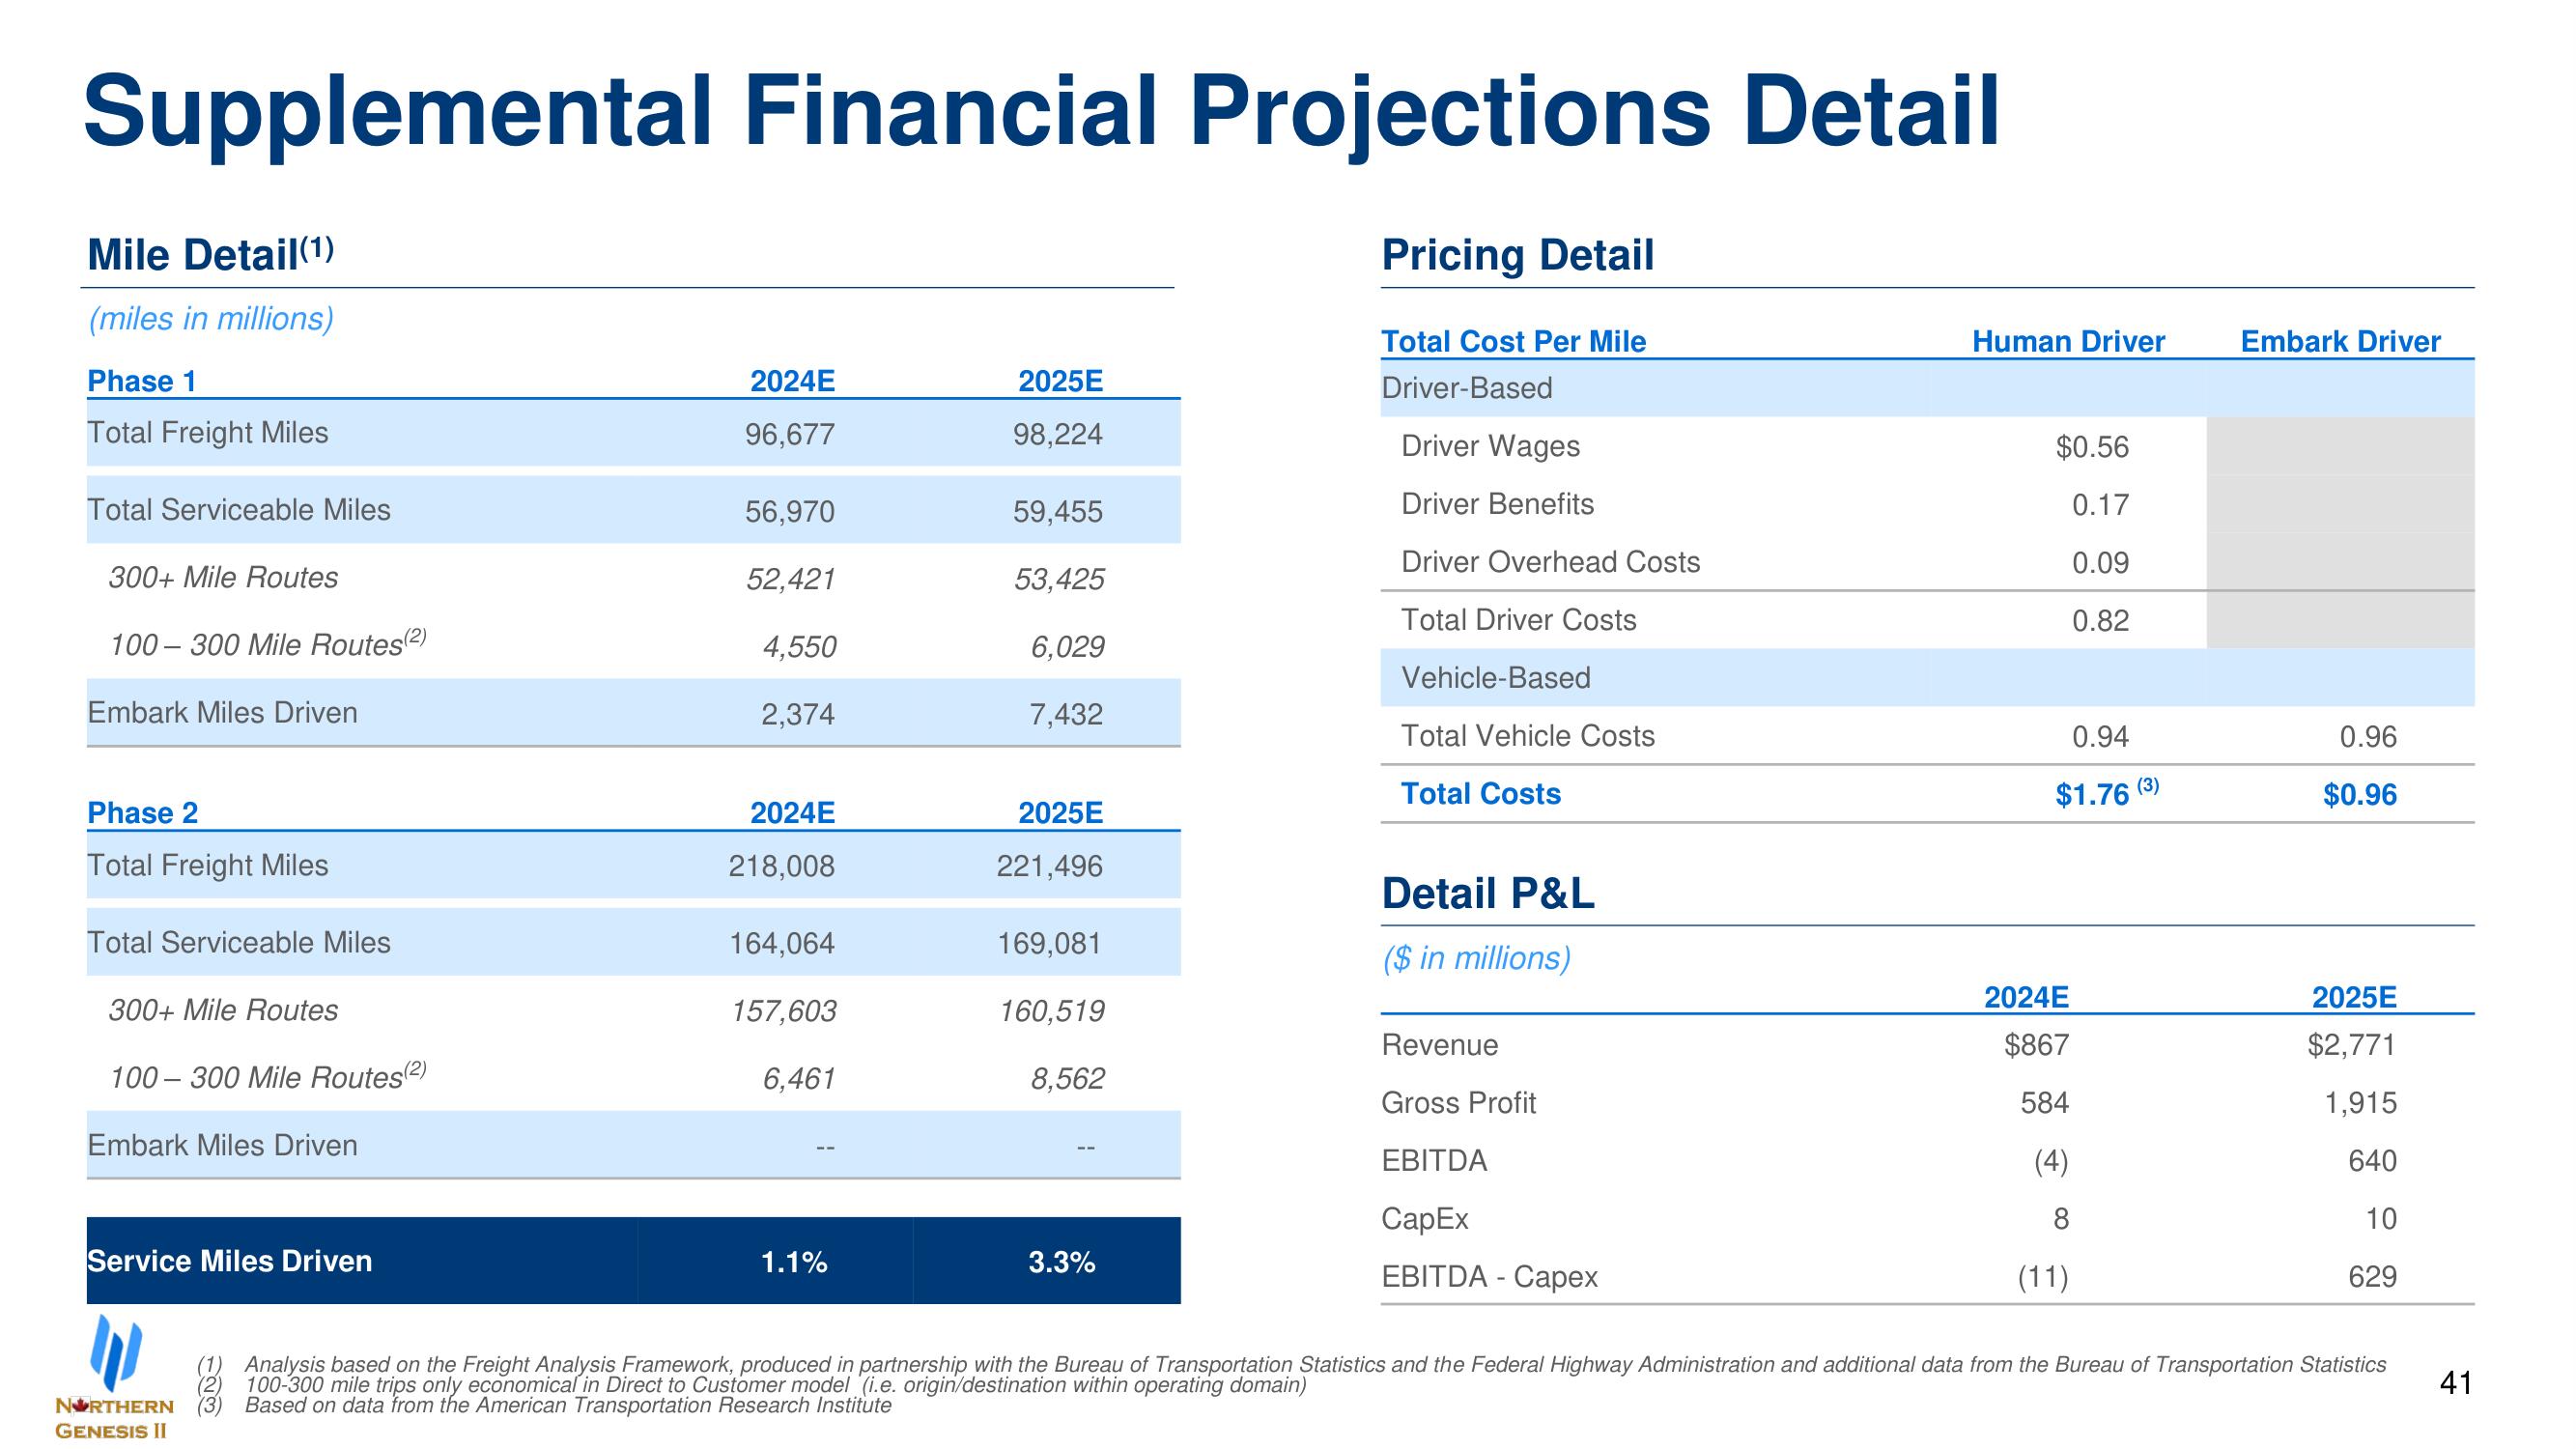
Supplemental Financial Projections Detail
Pricing Detail
Mile Detail (1¹)
(miles in millions)
Phase 1
Total Freight Miles
Total Serviceable Miles
300+ Mile Routes
100-300 Mile Routes(2)
Embark Miles Driven
Phase 2
Total Freight Miles
Total Serviceable Miles
300+ Mile Routes
100-300 Mile Routes(2)
Embark Miles Driven
Service Miles Driven
W
"1
NORTHERN
GENESIS II
2024E
96,677
56,970
52,421
4,550
2,374
2024E
218,008
164,064
157,603
6,461
1.1%
2025E
98,224
59,455
53,425
6,029
7,432
2025E
221,496
169,081
160,519
8,562
3.3%
Total Cost Per Mile
Driver-Based
Driver Wages
Driver Benefits
Driver Overhead Costs
Total Driver Costs
Vehicle-Based
Total Vehicle Costs
Total Costs
Detail P&L
($ in millions)
Revenue
Gross Profit
EBITDA
CapEx
EBITDA- Capex
Human Driver
$0.56
0.17
0.09
0.82
0.94
$1.76 (3)
2024E
$867
584
(4)
8
(11)
Embark Driver
0.96
$0.96
2025E
$2,771
1,915
640
10
629
Analysis based on the Freight Analysis Framework, produced in partnership with the Bureau of Transportation Statistics and the Federal Highway Administration and additional data from the Bureau of Transportation Statistics
100-300 mile trips only economical in Direct to Customer model (i.e. origin/destination within operating domain)
(3) Based on data from the American Transportation Research Institute
41View entire presentation