Cyxtera Investor Presentation Deck
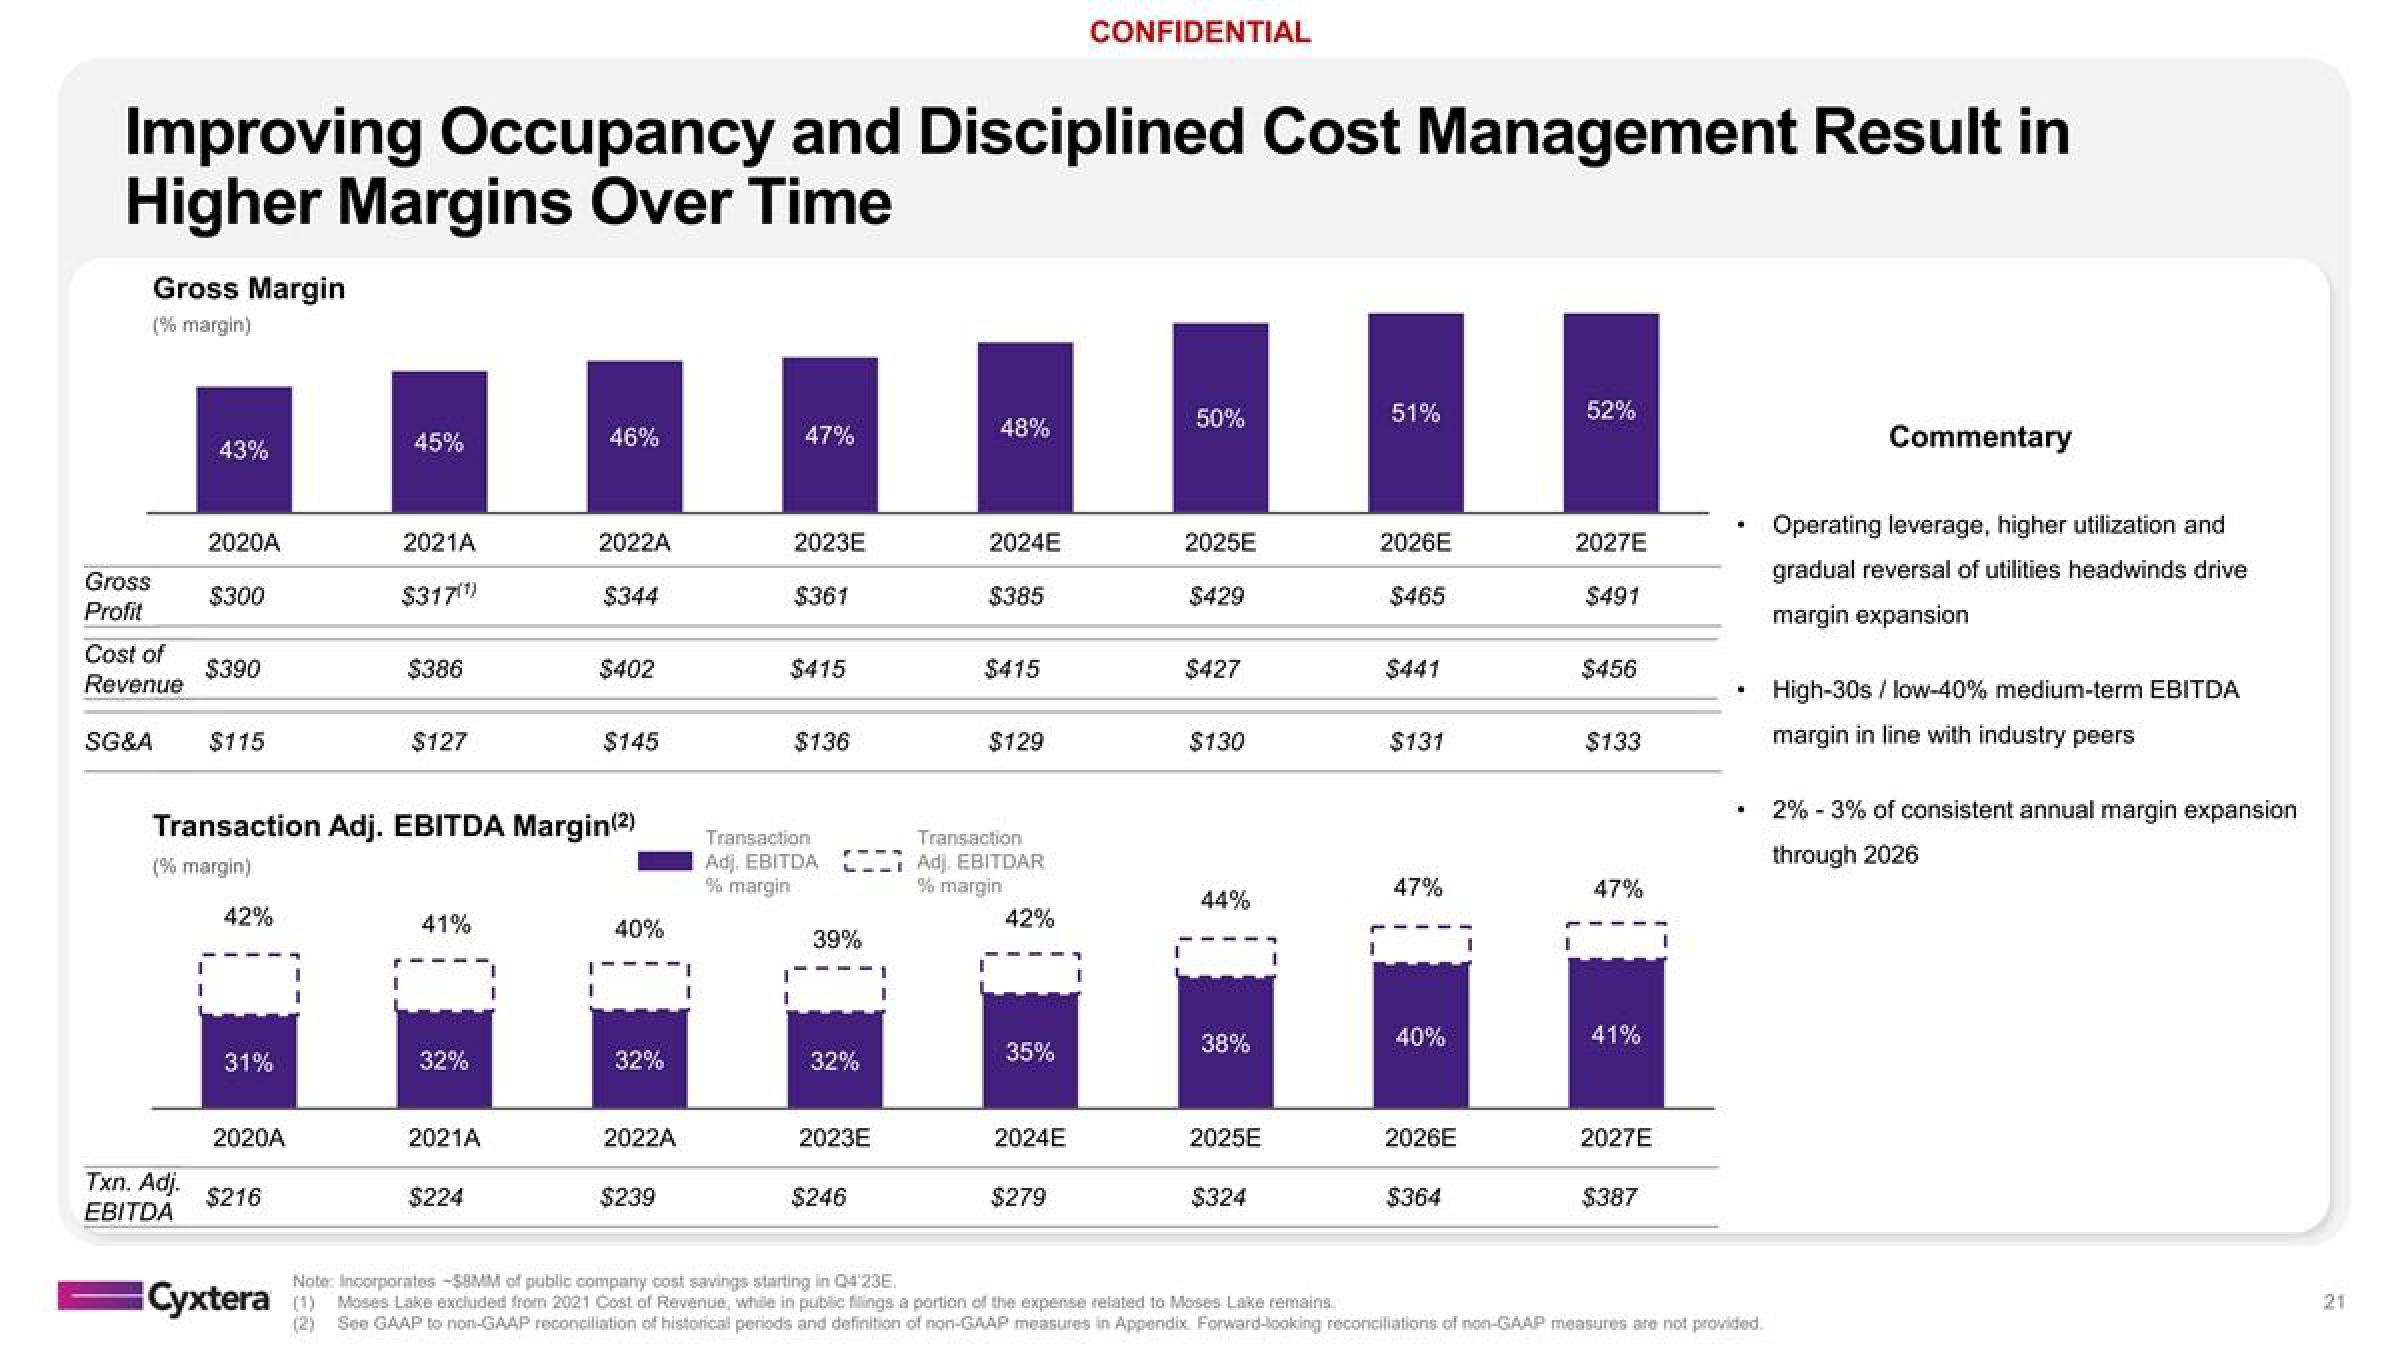
Improving Occupancy and Disciplined Cost Management Result in
Higher Margins Over Time
Gross Margin
(% margin)
Gross
Profit
Cost of
Revenue
43%
2020A
Txn. Adj.
EBITDA
$300
$390
SG&A $115
42%
31%
2020A
45%
$216
2021A
$317(¹)
$386
$127
Transaction Adj. EBITDA Margin(2)
(% margin)
41%
32%
2021A
$224
46%
1
2022A
$344
$402
$145
40%
32%
2022A
$239
I
47%
2023E
$361
$415
$136
Transaction
Adj. EBITDA
% margin
39%
32%
2023E
$246
T
48%
2024E
$385
$415
$129
Transaction
Adj. EBITDAR
% margin
42%
35%
2024E
CONFIDENTIAL
$279
50%
2025E
$429
$427
$130
44%
38%
2025E
$324
I
51%
2026E
$465
$441
$131
47%
40%
2026E
$364
I
52%
SAMSON
2027E
$491
$456
$133
47%
41%
2027E
$387
I
.
.
Note: Incorporates -58MM of public cost savings starting in Q4'23E.
Cyxtera (1) Moses Lake excluded from 2021 Cost of Revenue, while in public filings a portion of the expense related to Moses Lake remains.
(2) See GAAP to non-GAAP reconciliation of historical periods and definition of non-GAAP measures in Appendix Forward-looking reconciliations of non-GAAP measures are not provided.
Commentary
Operating leverage, higher utilization and
gradual reversal of utilities headwinds drive
margin expansion
High-30s / low-40% medium-term EBITDA
margin in line with industry peers
2% -3% of consistent annual margin expansion
through 2026
21View entire presentation