Silicon Valley Bank Results Presentation Deck
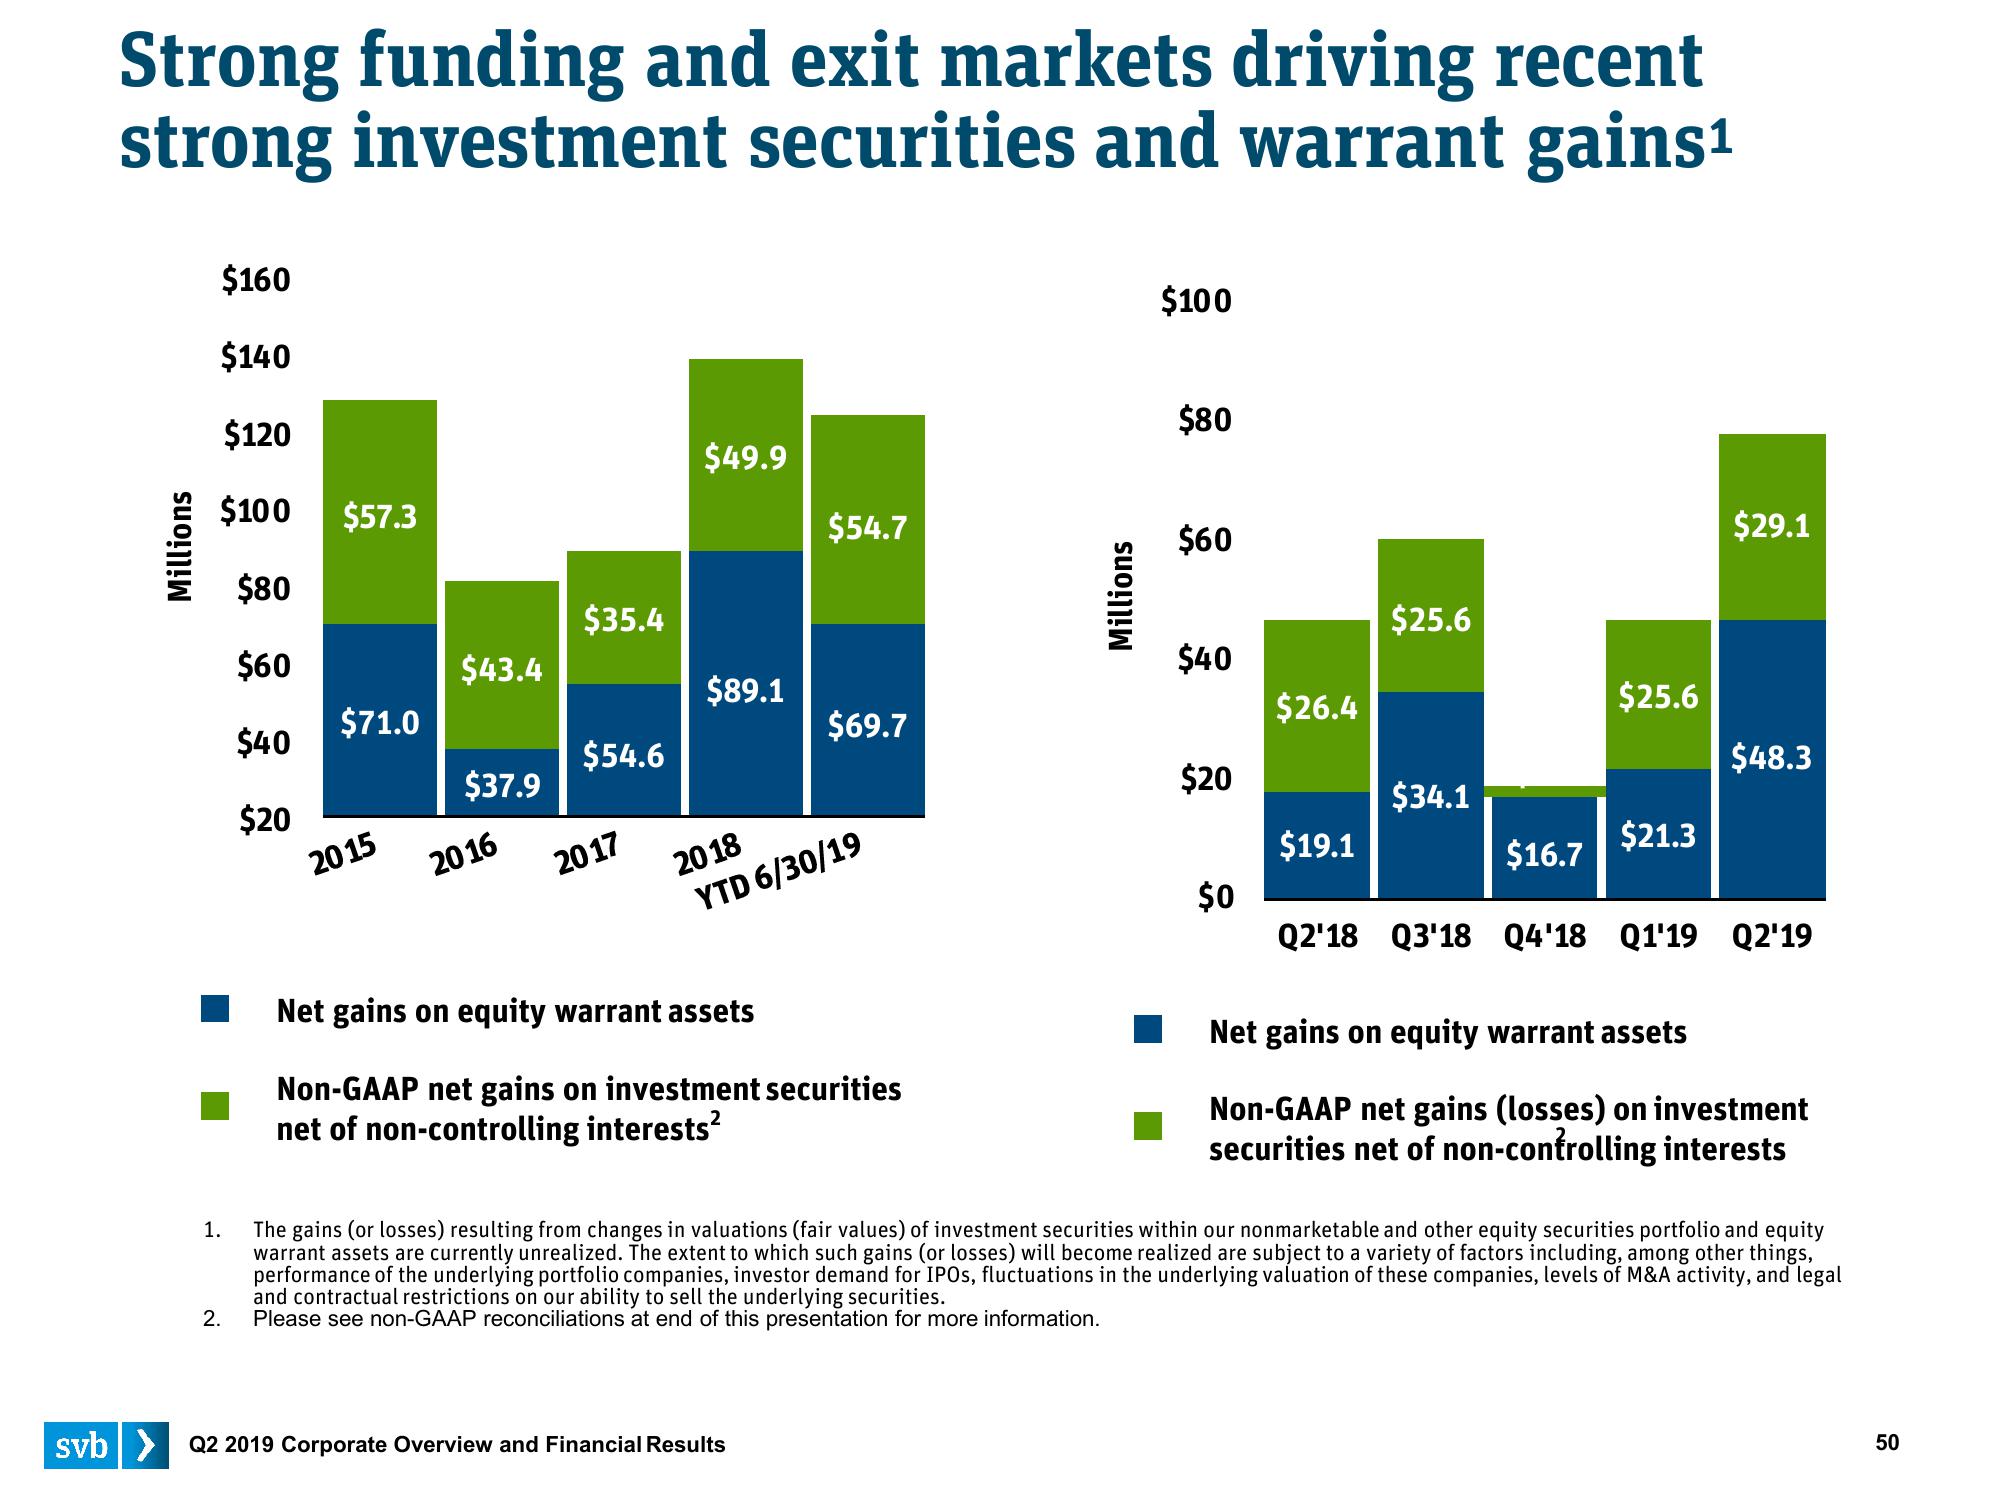
Strong funding and exit markets driving recent
strong investment securities and warrant gains¹
Millions
$160
$140
$120
$100 $57.3
$80
$60
$40
$20
1.
2.
$71.0
2015
$43.4
$37.9
2016
$35.4
$54.6
2017
$49.9
$89.1
$54.7
$69.7
2018
YTD 6/30/19
Net gains on equity warrant assets
Non-GAAP net gains on investment securities
net of non-controlling interests²
svb> Q2 2019 Corporate Overview and Financial Results
Millions
$100
$80
$60
$40
$20
$0
$26.4
$19.1
$25.6
$34.1
$16.7
$25.6
$21.3
$29.1
$48.3
Q2'18 Q3'18 Q4'18 Q1'19 Q2'19
Net gains on equity warrant assets
Non-GAAP net gains (losses) on investment
securities net of non-controlling interests
The gains (or losses) resulting from changes in valuations (fair values) of investment securities within our nonmarketable and other equity securities portfolio and equity
warrant assets are currently unrealized. The extent to which such gains (or losses) will become realized are subject to a variety of factors including, among other things,
performance of the underlying portfolio companies, investor demand for IPOs, fluctuations in the underlying valuation of these companies, levels of M&A activity, and legal
and contractual restrictions on our ability to sell the underlying securities.
Please see non-GAAP reconciliations at end of this presentation for more information.
50View entire presentation