Wix Results Presentation Deck
our focus on product innovation and efficient marketing execution leads to
strong financial results.
Financial Performance
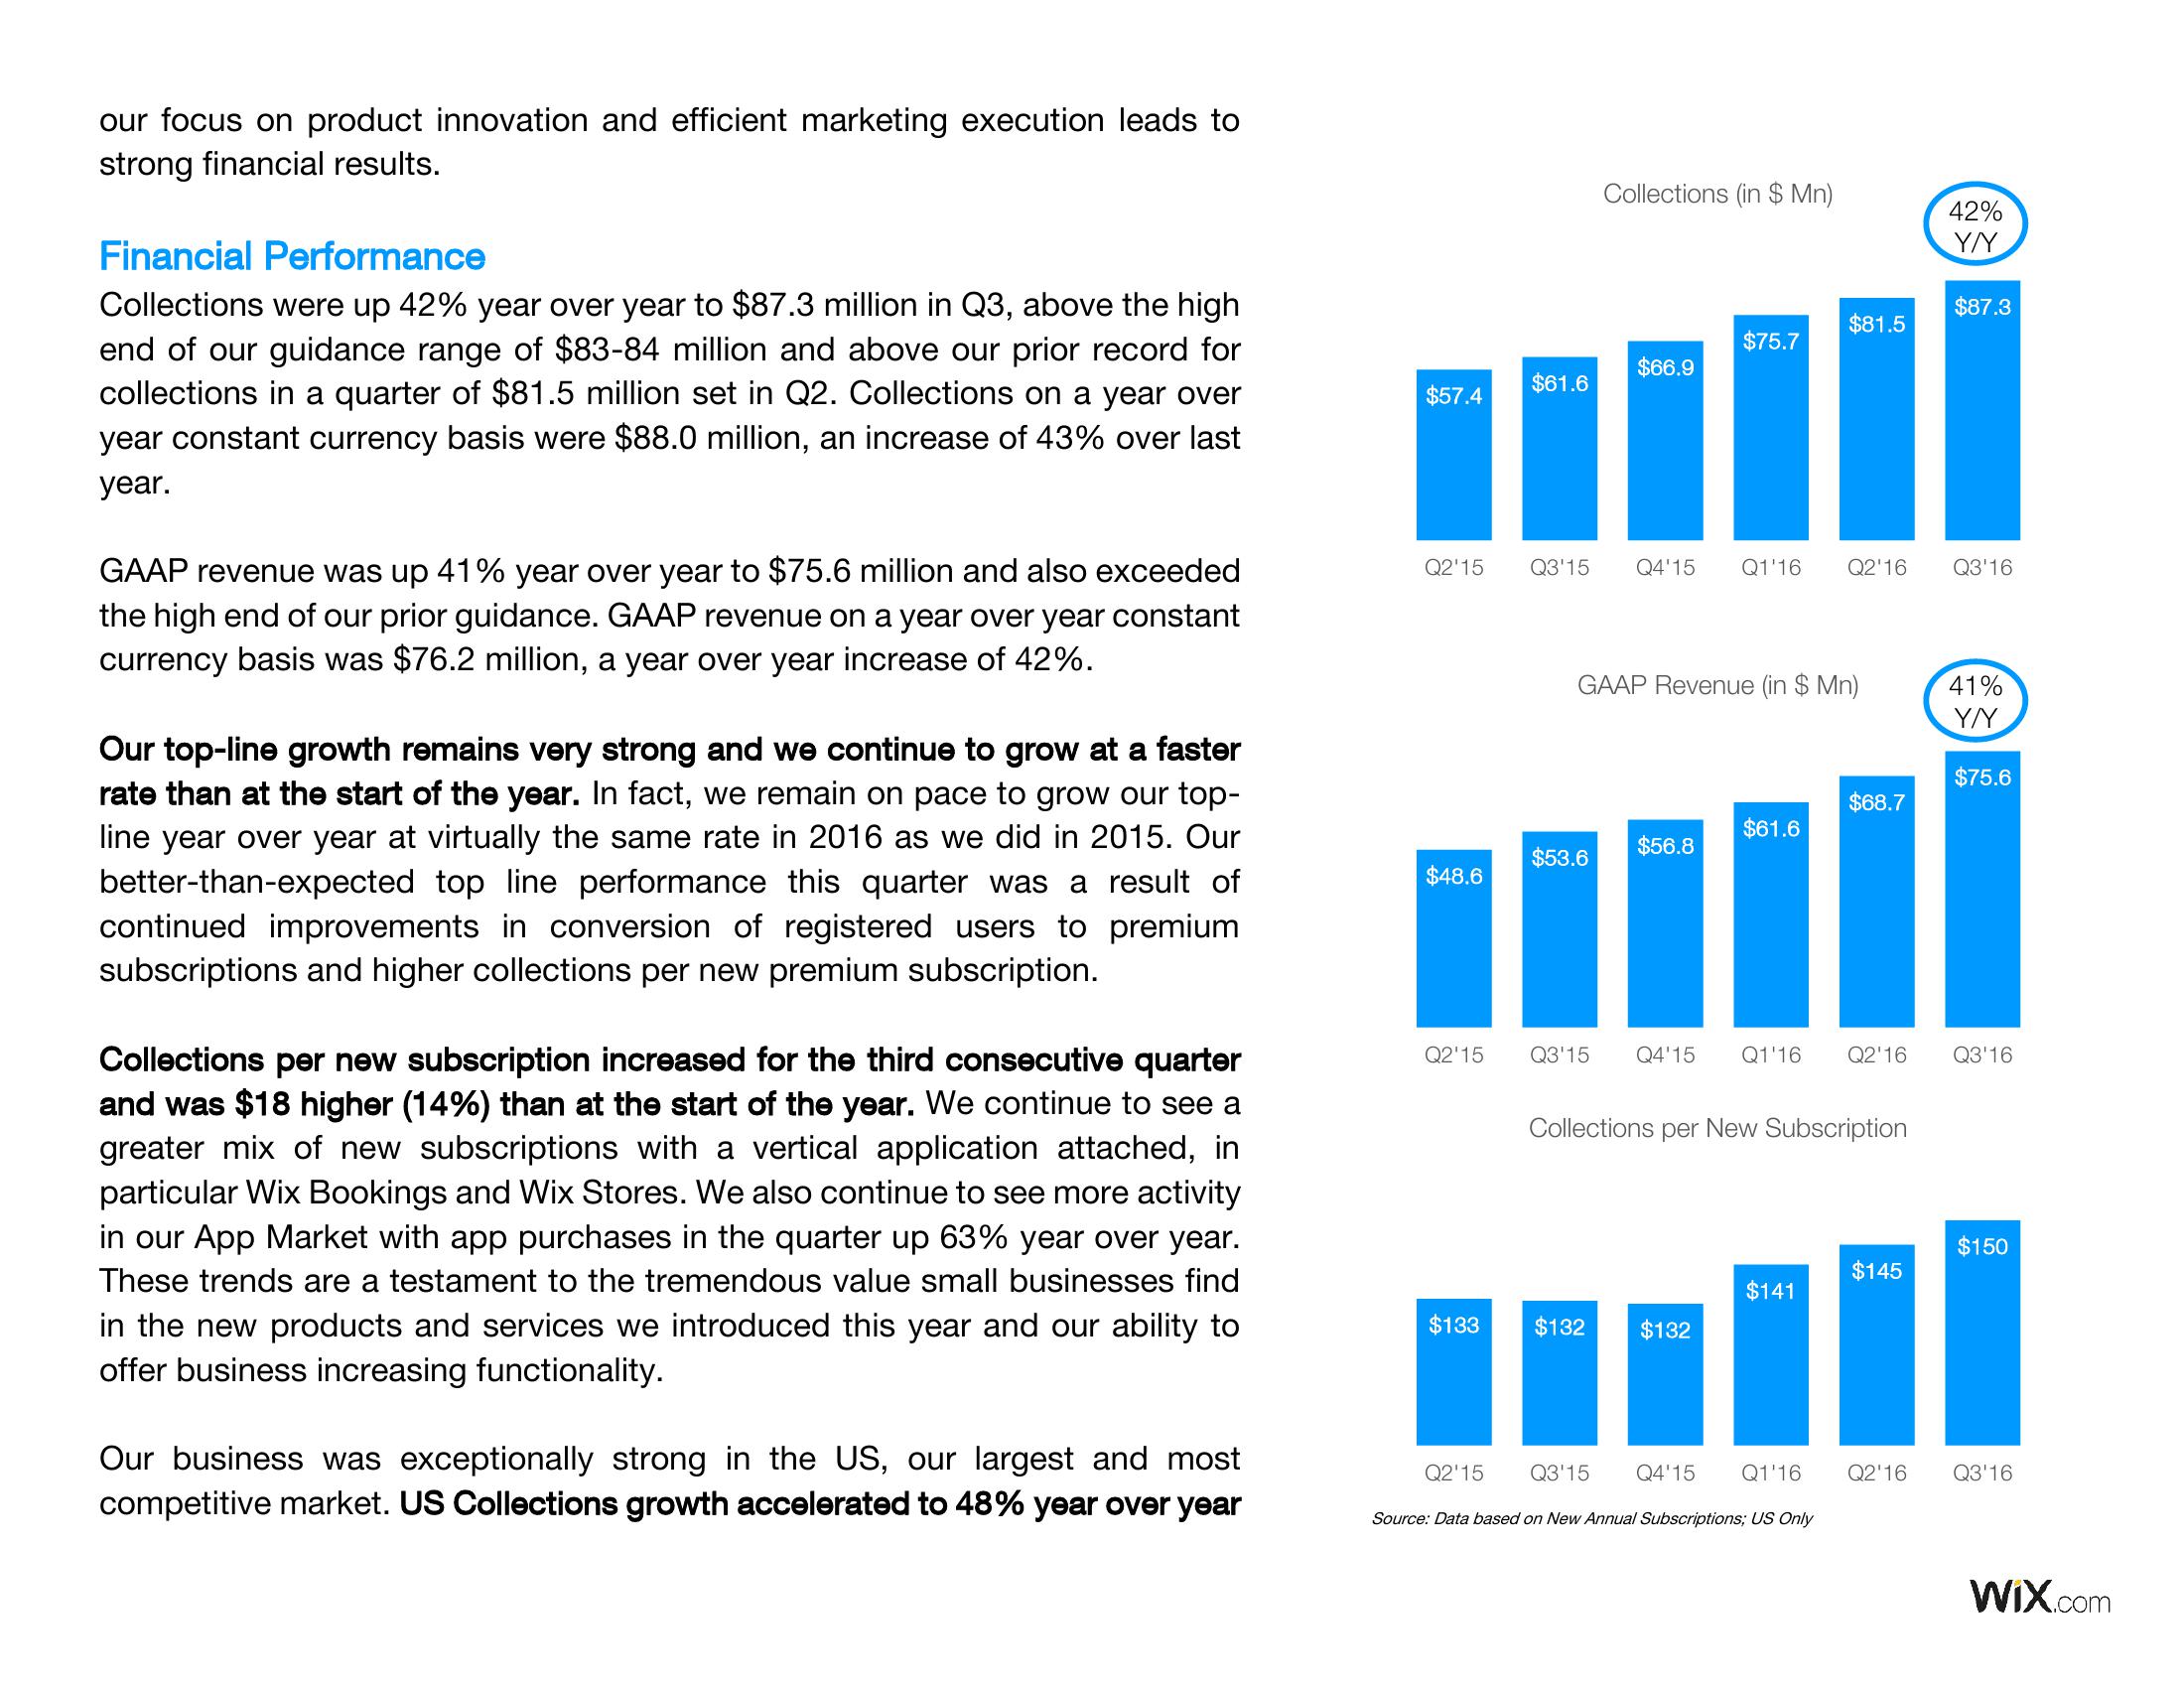
Collections were up 42% year over year to $87.3 million in Q3, above the high
end of our guidance range of $83-84 million and above our prior record for
collections in a quarter of $81.5 million set in Q2. Collections on a year over
year constant currency basis were $88.0 million, an increase of 43% over last
year.
GAAP revenue was up 41% year over year to $75.6 million and also exceeded
the high end of our prior guidance. GAAP revenue on a year over year constant
currency basis was $76.2 million, a year over year increase of 42%.
Our top-line growth remains very strong and we continue to grow at a faster
rate than at the start of the year. In fact, we remain on pace to grow our top-
line year over year at virtually the same rate in 2016 as we did in 2015. Our
better-than-expected top line performance this quarter was a result of
continued improvements in conversion of registered users to premium
subscriptions and higher collections per new premium subscription.
Collections per new subscription increased for the third consecutive quarter
and was $18 higher (14%) than at the start of the year. We continue to see a
greater mix of new subscriptions with a vertical application attached, in
particular Wix Bookings and Wix Stores. We also continue to see more activity
in our App Market with app purchases in the quarter up 63% year over year.
These trends are a testament to the tremendous value small businesses find
in the new products and services we introduced this year and our ability to
offer business increasing functionality.
Our business was exceptionally strong in the US, our largest and most
competitive market. US Collections growth accelerated to 48% year over year
$57.4
Q2'15
$48.6
$61.6
$133
$53.6
Q2'15 Q3'15
Collections (in $ Mn)
$66.9
Q3'15 Q4'15 Q1'16 Q2'16
GAAP Revenue (in $ Mn)
$132
$75.7
$56.8
$61.6
$132
$81.5
Collections per New Subscription
$141
$68.7
Q2'15 Q3'15 Q4'15 Q1'16
Source: Data based on New Annual Subscriptions; US Only
42%
Y/Y
Q4'15 Q1'16 Q2'16 Q3'16
$145
$87.3
Q3'16
41%
Y/Y
$75.6
$150
Q2'16 Q3'16
Wix.comView entire presentation