Experian ESG Presentation Deck
Executive Summary
Improving Financial Health
Data
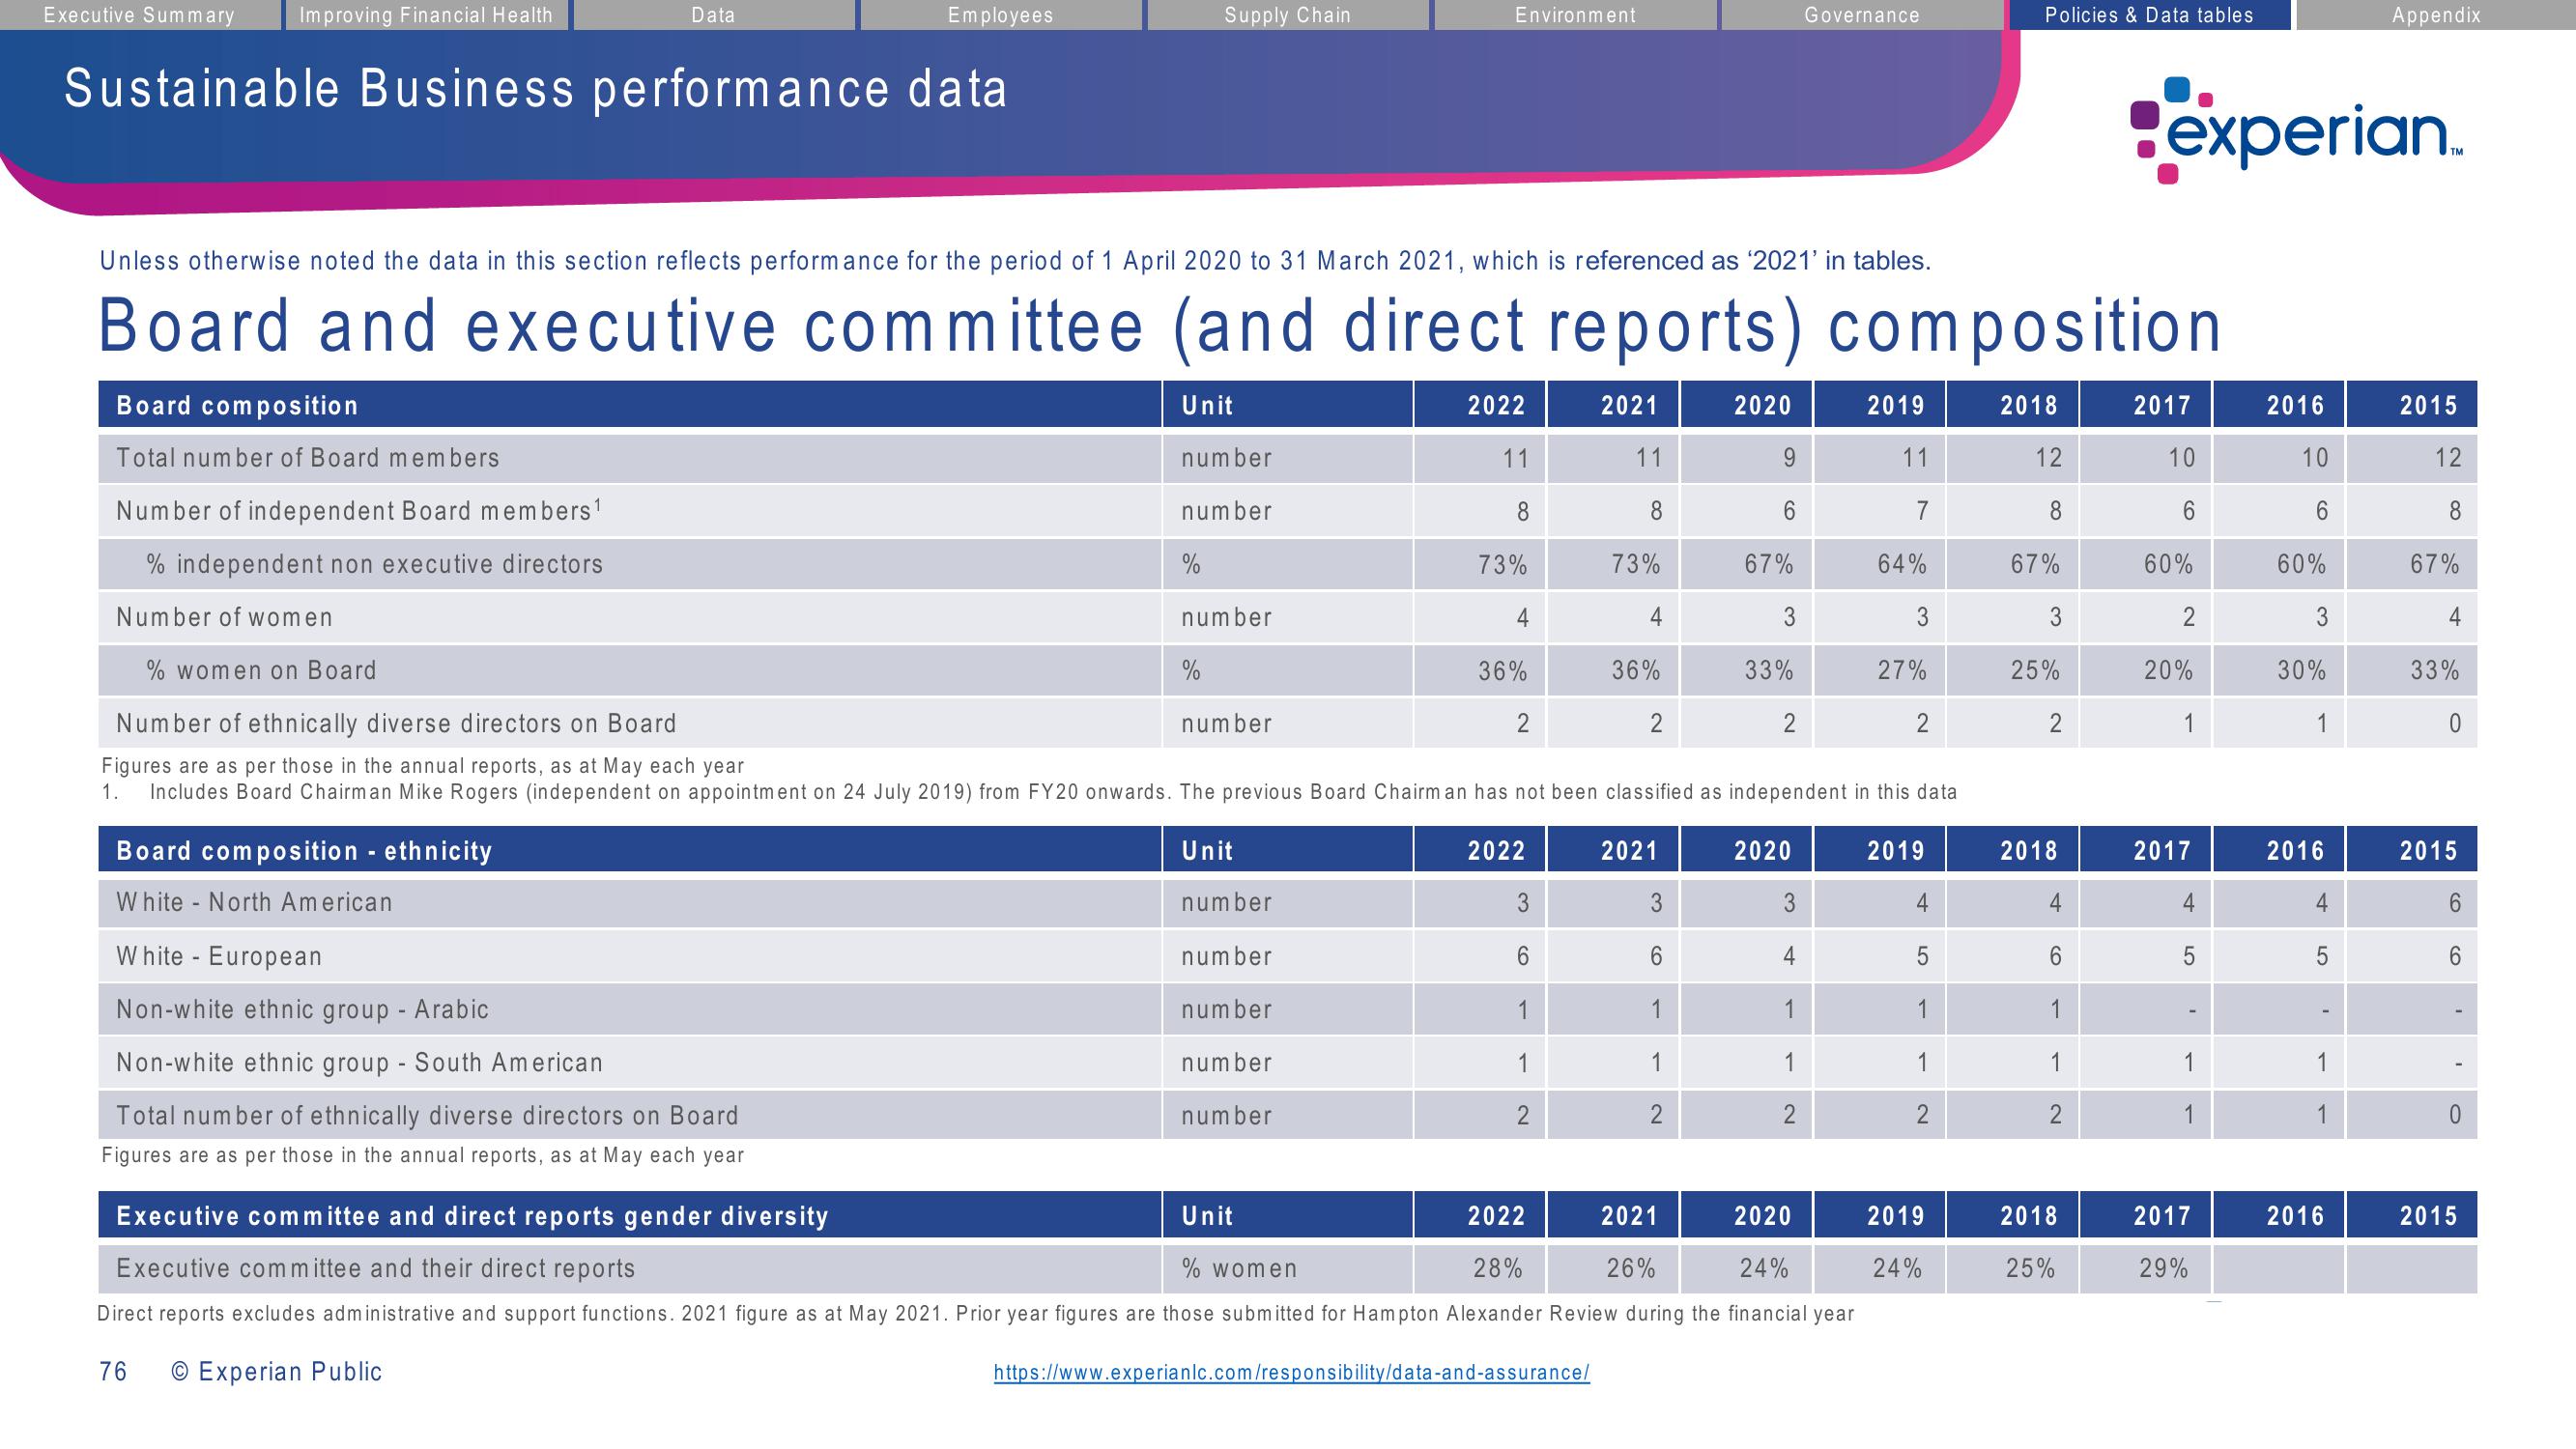
Sustainable Business performance data
Board composition
Total number of Board members
Number of independent Board members ¹
% independent non executive directors
Number of women
Employees
White - European
Non-white ethnic group - Arabic
Non-white ethnic group - South American
Total number of ethnically diverse directors on Board
Figures are as per those in the annual reports, as at May each year
76
Supply Chain
Unless otherwise noted the data in this section reflects performance for the period of 1 April 2020 to 31 March 2021, which is referenced as '2021' in tables.
Board and executive committee (and direct reports) composition
2018
Unit
number
number
%
number
Environment
number
2022
11
8
73%
4
36%
2
2022
3
6
1
1
2
2021
11
8
73%
4
% women on Board
Number of ethnically diverse directors on Board
Figures are as per those in the annual reports, as at May each year
1. Includes Board Chairman Mike Rogers (independent on appointment on 24 July 2019) from FY20 onwards. The previous Board Chairman has not been classified as independent in this data
Board composition - ethnicity
Unit
number
White - North American
number
number
number
number
https://www.experianlc.com/responsibility/data-and-assurance/
36%
2
2021
2020
3
6
1
1
2
9
6
67%
3
33%
2
2020
Governance
3
4
1
1
2
Executive committee and direct reports gender diversity
2022
2021
2020
Unit
% women
28%
26%
24%
Executive committee and their direct reports
Direct reports excludes administrative and support functions. 2021 figure as at May 2021. Prior year figures are those submitted for Hampton Alexander Review during the financial year
O Experian Public
2019
11
7
64%
3
27%
2019
4
5
1
1
2
Policies & Data tables
2019
24%
12
8
67%
3
25%
2
2018
4
6
1
1
2
2018
25%
experian.
2017
10
6
60%
2
20%
2017
4
5
1
1
2017
29%
2016
10
6
60%
3
30%
2016
4
LO
5
1
1
Appendix
2016
2015
12
8
67%
4
33%
0
2015
6
6
0
2015View entire presentation