Dutch Bros Investor Presentation Deck
ANNUAL FINANCIALS
2
(UNITS)
538
271
267
2021
133
25%
125
46%
25.5%
SHOPS
2021
671
396
275
Company-Operated
2022
150
22%
Franchised
(% OF COMPANY-OPERATED SHOP SALES)
COMPANY-OPERATED SHOP
CONTRIBUTION MARGIN
12
At least 130
Company-
operated
Outlook
24.6%
2022
($M)
($M)
$498
$404
$94
2021
$(118)
$84
$241M
48%
2021
16.9%
$236M
58%
REVENUE
Net Income
$739
$640
Company-Operated
$7M
8%
$99
2022
NET INCOME AND ADJUSTED EBITDA
$(19)
$91
2022
12.3%
$211M - $261M
29%-35%
Adj. EBITDA
Franchised
$950M - $1B
$34M
37%
Outlook
$125
Outlook
Adj.
EBITDA %
123
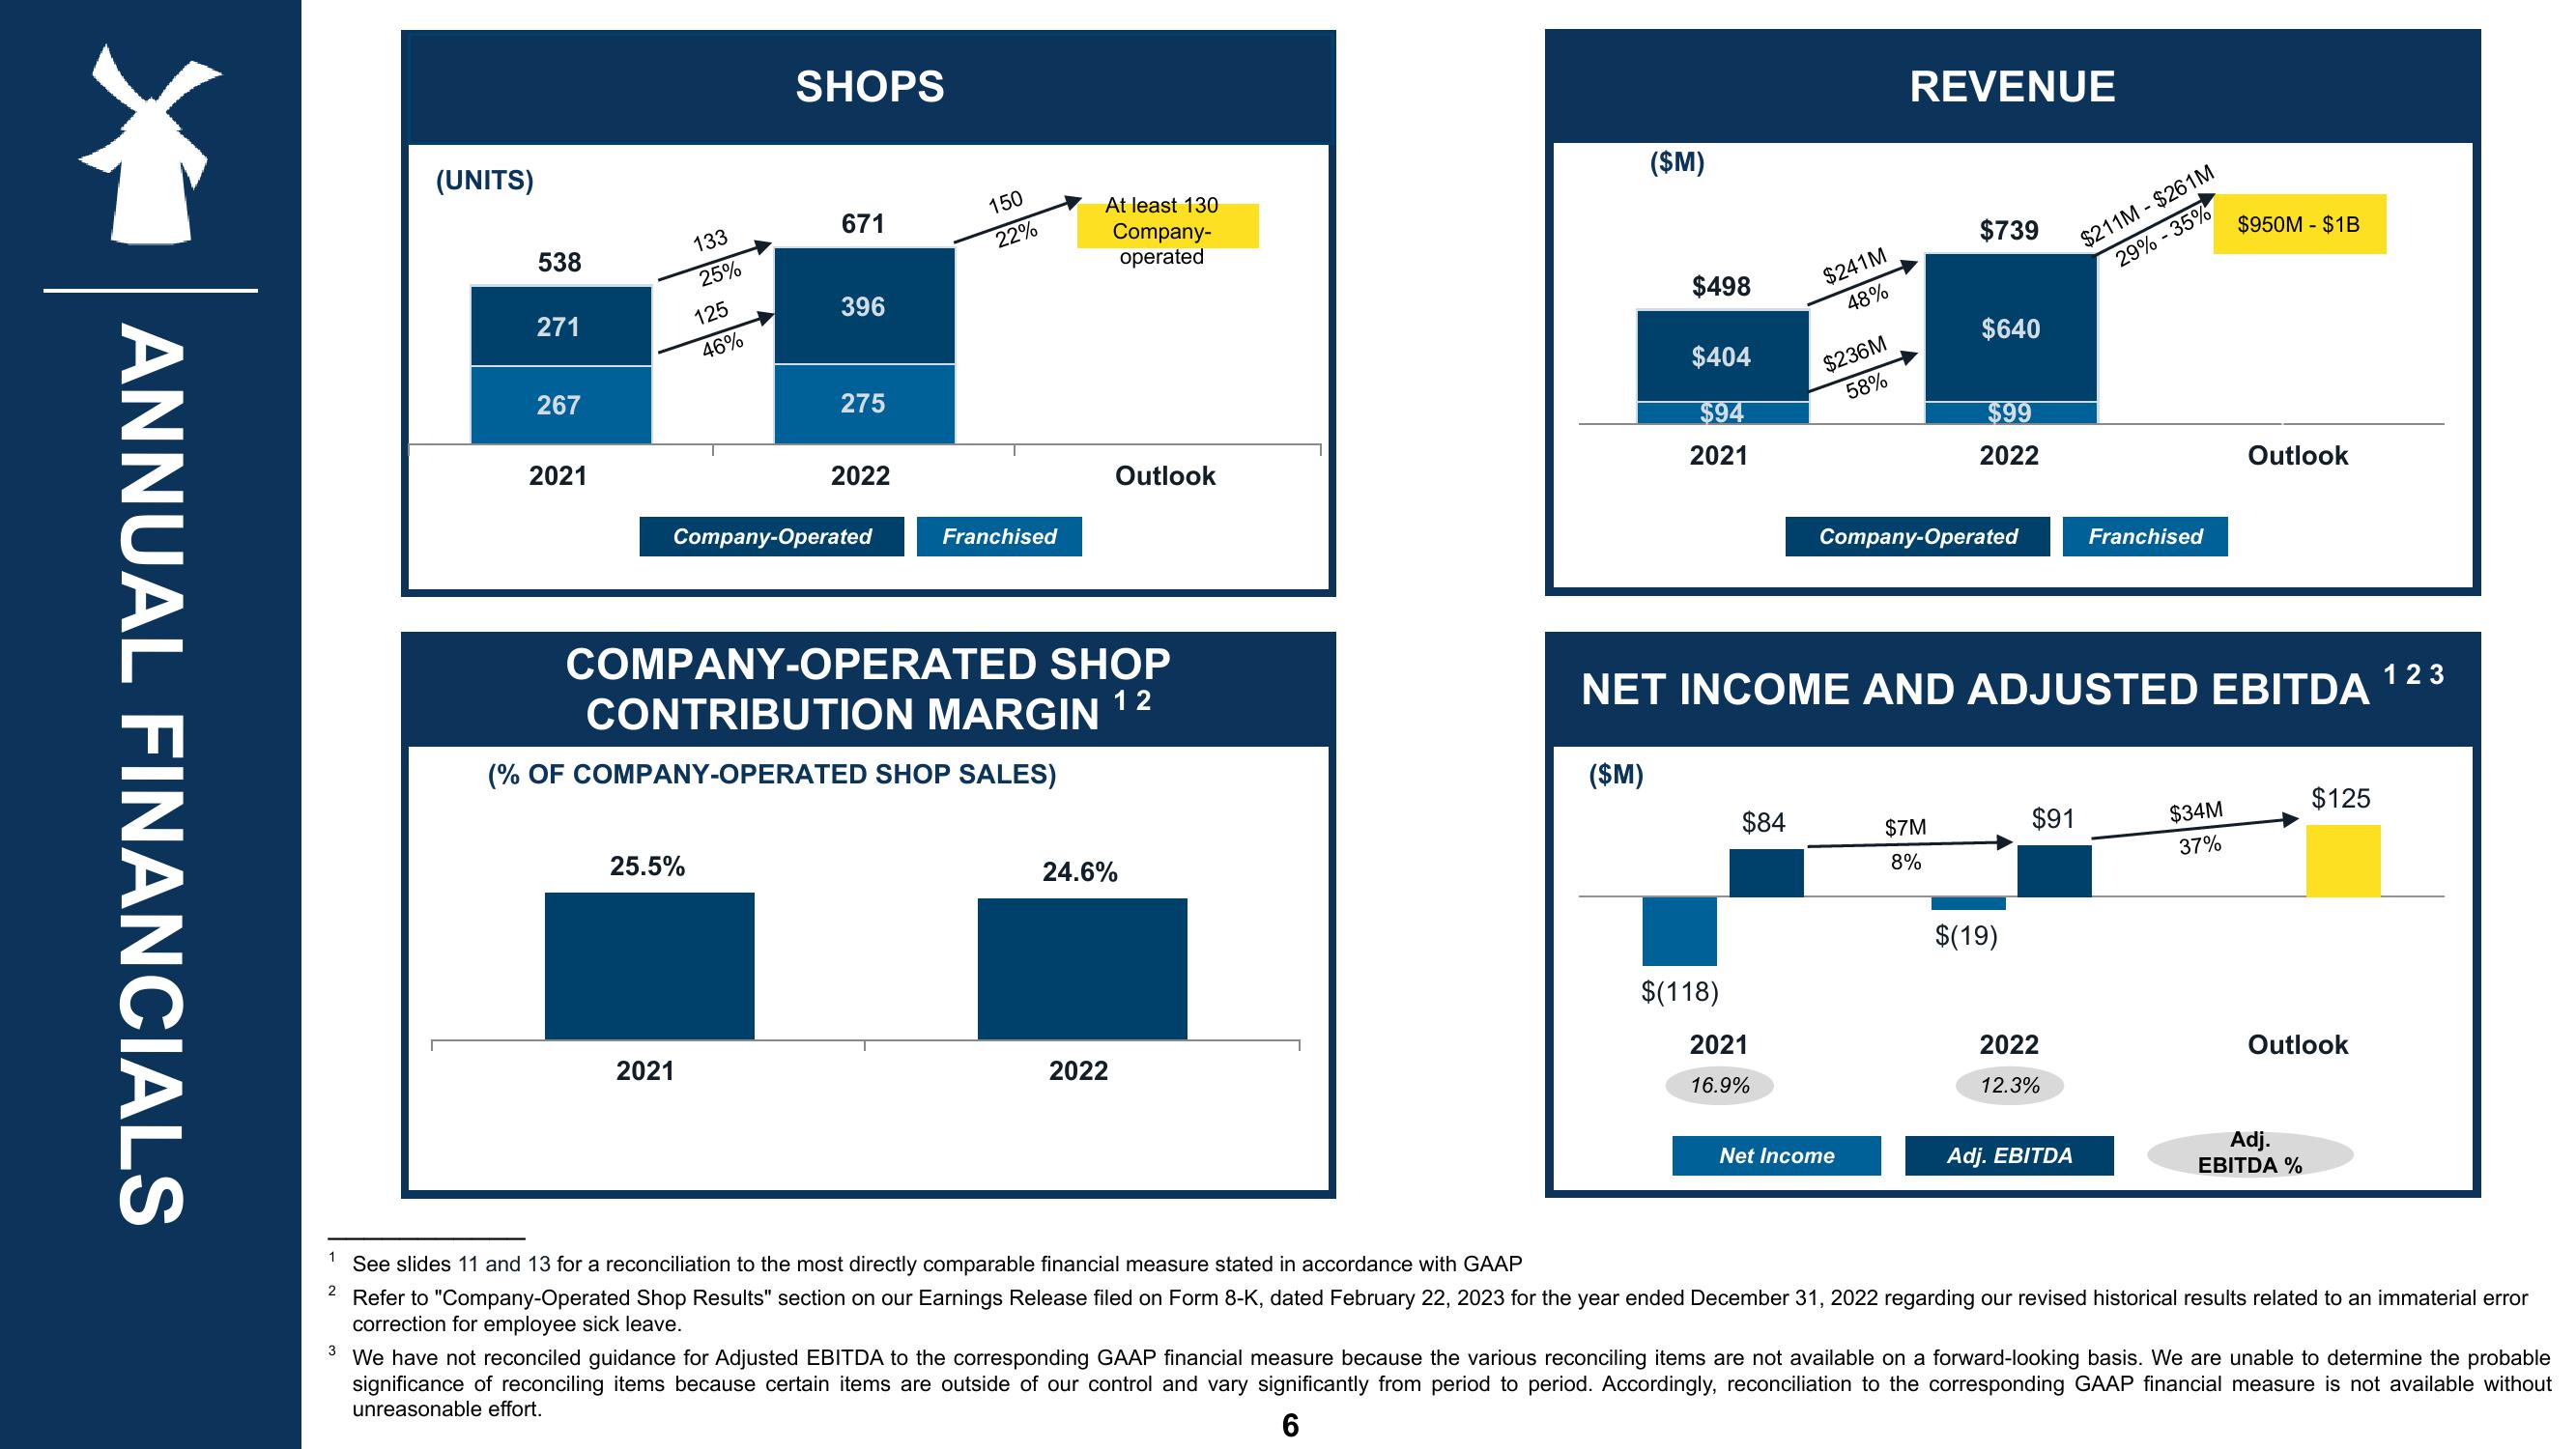
See slides 11 and 13 for a reconciliation to the most directly comparable financial measure stated in accordance with GAAP
Refer to "Company-Operated Shop Results" section on our Earnings Release filed on Form 8-K, dated February 22, 2023 for the year ended December 31, 2022 regarding our revised historical results related to an immaterial error
correction for employee sick leave.
3 We have not reconciled guidance for Adjusted EBITDA to the corresponding GAAP financial measure because the various reconciling items are not available on a forward-looking basis. We are unable to determine the probable
significance of reconciling items because certain items are outside of our control and vary significantly from period to period. Accordingly, reconciliation to the corresponding GAAP financial measure is not available without
unreasonable effort.
6View entire presentation