Blend Results Presentation Deck
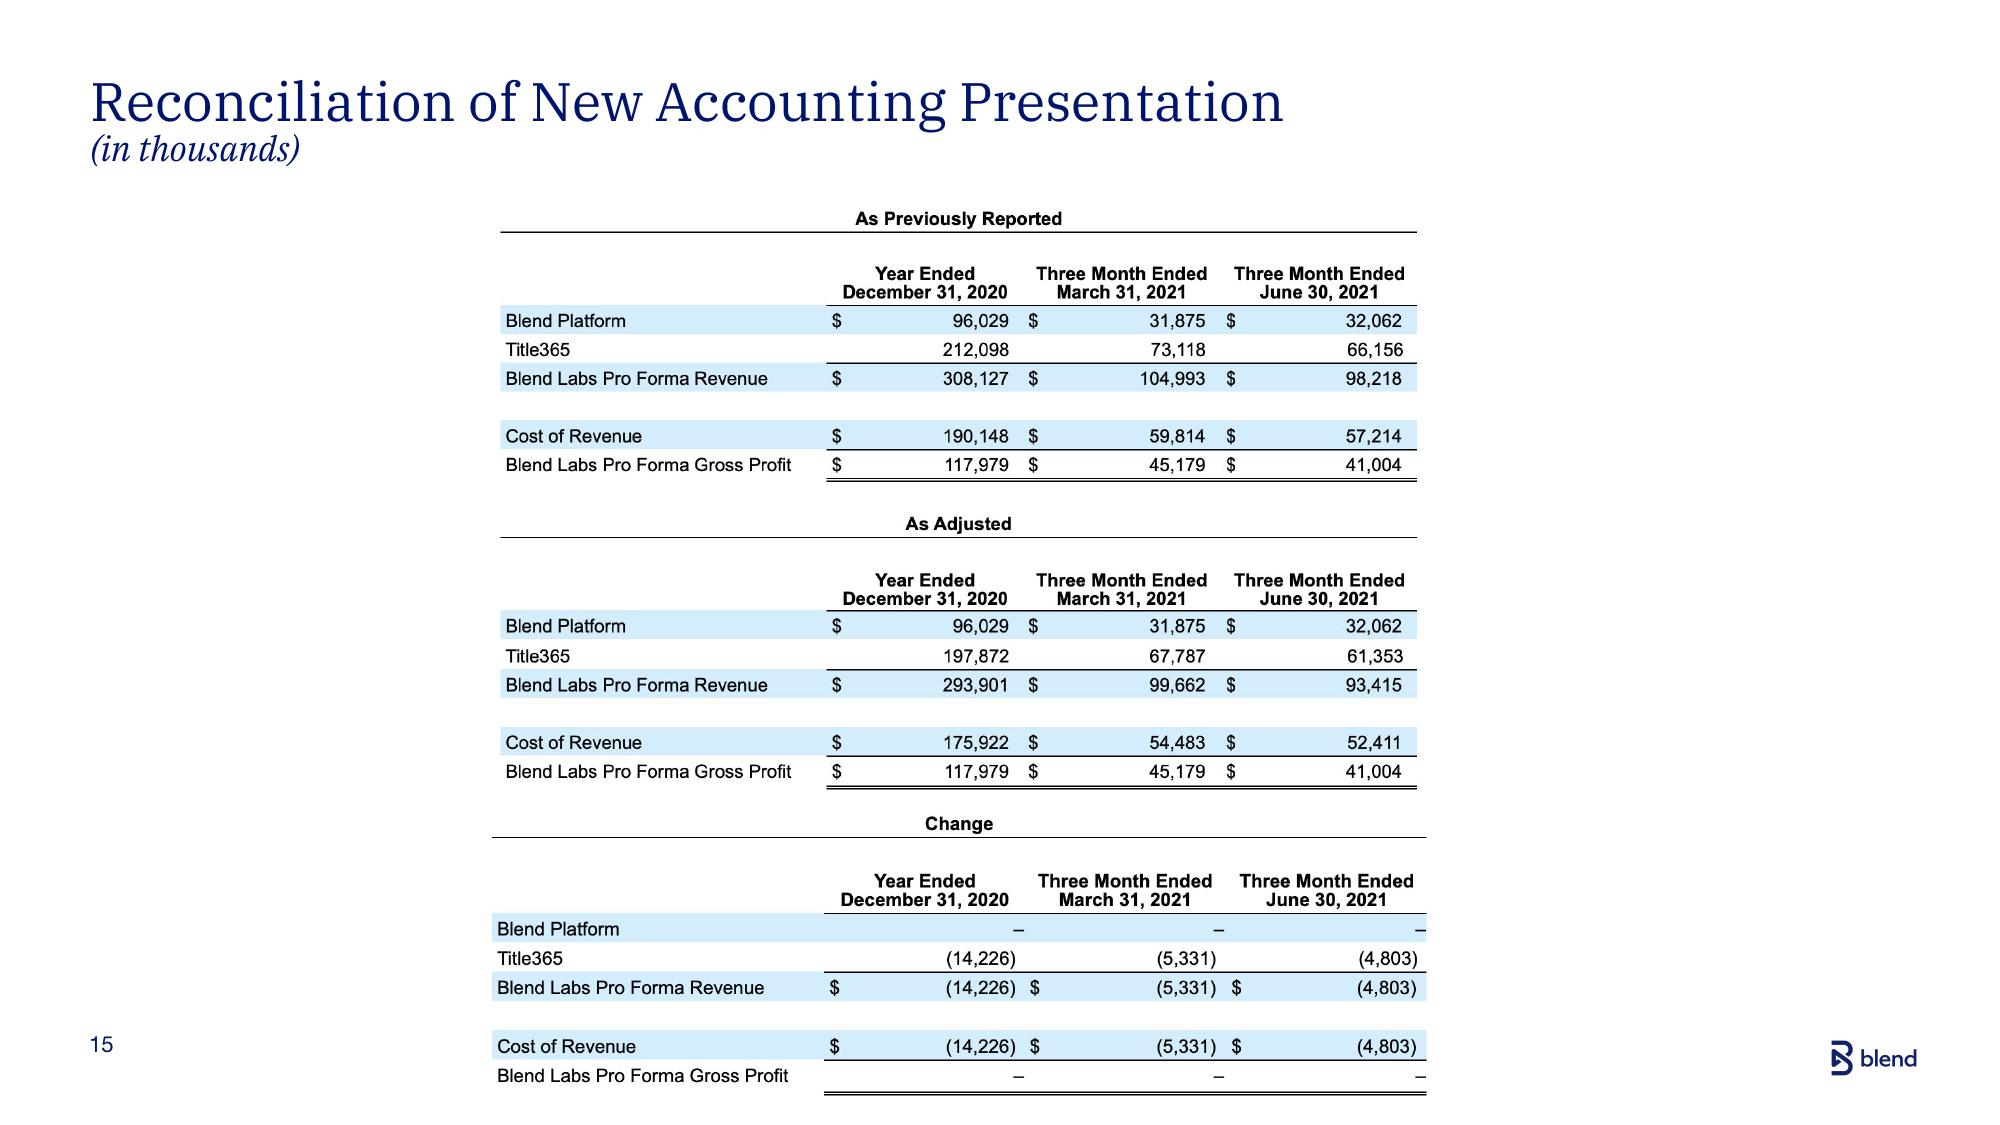
Reconciliation of New Accounting Presentation
(in thousands)
15
Blend Platform
Title365
Blend Labs Pro Forma Revenue
Cost of Revenue
Blend Labs Pro Forma Gross Profit
Blend Platform
Title365
Blend Labs Pro Forma Revenue
Cost of Revenue
Blend Labs Pro Forma Gross Profit
Blend Platform
Title365
Blend Labs Pro Forma Revenue
Cost of Revenue
Blend Labs Pro Forma Gross Profit
$
$
$
$
Year Ended
December 31, 2020
96,029
212,098
308,127 $
$
$
$
$
$
As Previously Reported
$
As Adjusted
Year Ended
December 31, 2020
96,029
197,872
293,901 $
Three Month Ended
March 31, 2021
190,148 $
117,979 $
Year Ended
December 31, 2020
$
Change
175,922 $
117,979 $
Three Month Ended
March 31, 2021
$
(14,226)
(14,226) $
31,875 $
73,118
104,993 $
(14,226) $
Three Month Ended
June 30, 2021
59,814 $
45,179 $
Three Month Ended
March 31, 2021
31,875 $
67,787
99,662
Three Month Ended
June 30, 2021
32,062
61,353
93,415
$
54,483 $
45,179 $
32,062
66,156
98,218
(5,331)
(5,331) $
57,214
41,004
(5,331) $
Three Month Ended
June 30, 2021
52,411
41,004
(4,803)
(4,803)
(4,803)
blendView entire presentation