First Citizens BancShares Results Presentation Deck
Net interest income and margin rate sensitivity
25.0%
20.0%
15.0%
10.0%
5.0%
0.0%
(5.0)%
(10.0)% (9.0)%
(15.0)%
(20.0) (18.9)%
(25.0)%
Down
200
(4.5)%
(9.4)%
Down
100
(1.1)%
4Q23
(2.3)%
Down 25
Shock
3Q23 Interest Rate Sensitivity
($ in millions)
NII NIM NII
+100 bps shock $ 162 0.32 %$ 182
+100 bps ramp
-100 bps ramp
-100 bps shock
13
0.03
(13) (0.03)
(164) (0.32)
2.3%
1.1%
Up 25
Ramp
Illustrative impacts to NII & NIM (1)
1Q24
2Q24
9.2%
4.4%
NIM NII
0.36 % $ 174
60 0.12
(60) (0.12)
(185) (0.36)
Up 100
18.3%
8.8%
Up 200
3Q24
NIM NII
0.34 %$ 171
106 0.21
(107) (0.21)
(178) (0.35)
NIM
0.33%
154 0.30
(155) (0.30)
(176) (0.34)
0
O
O
O
O
Highlights
Continued asset sensitive interest rate risk profile. The
magnitude of asset sensitivity increased with the SVB
acquisition primarily due to:
O
O
O
O
Higher cash balances to manage liquidity risk
from acquired portfolios and businesses,
Addition of a fixed rate Purchase Money Note,
increasing liability duration (-$36 billion at
September 30, 2023), and a
Increase in loans that are primarily linked to
floating rate indices (~$57 billion at September
30, 2023).
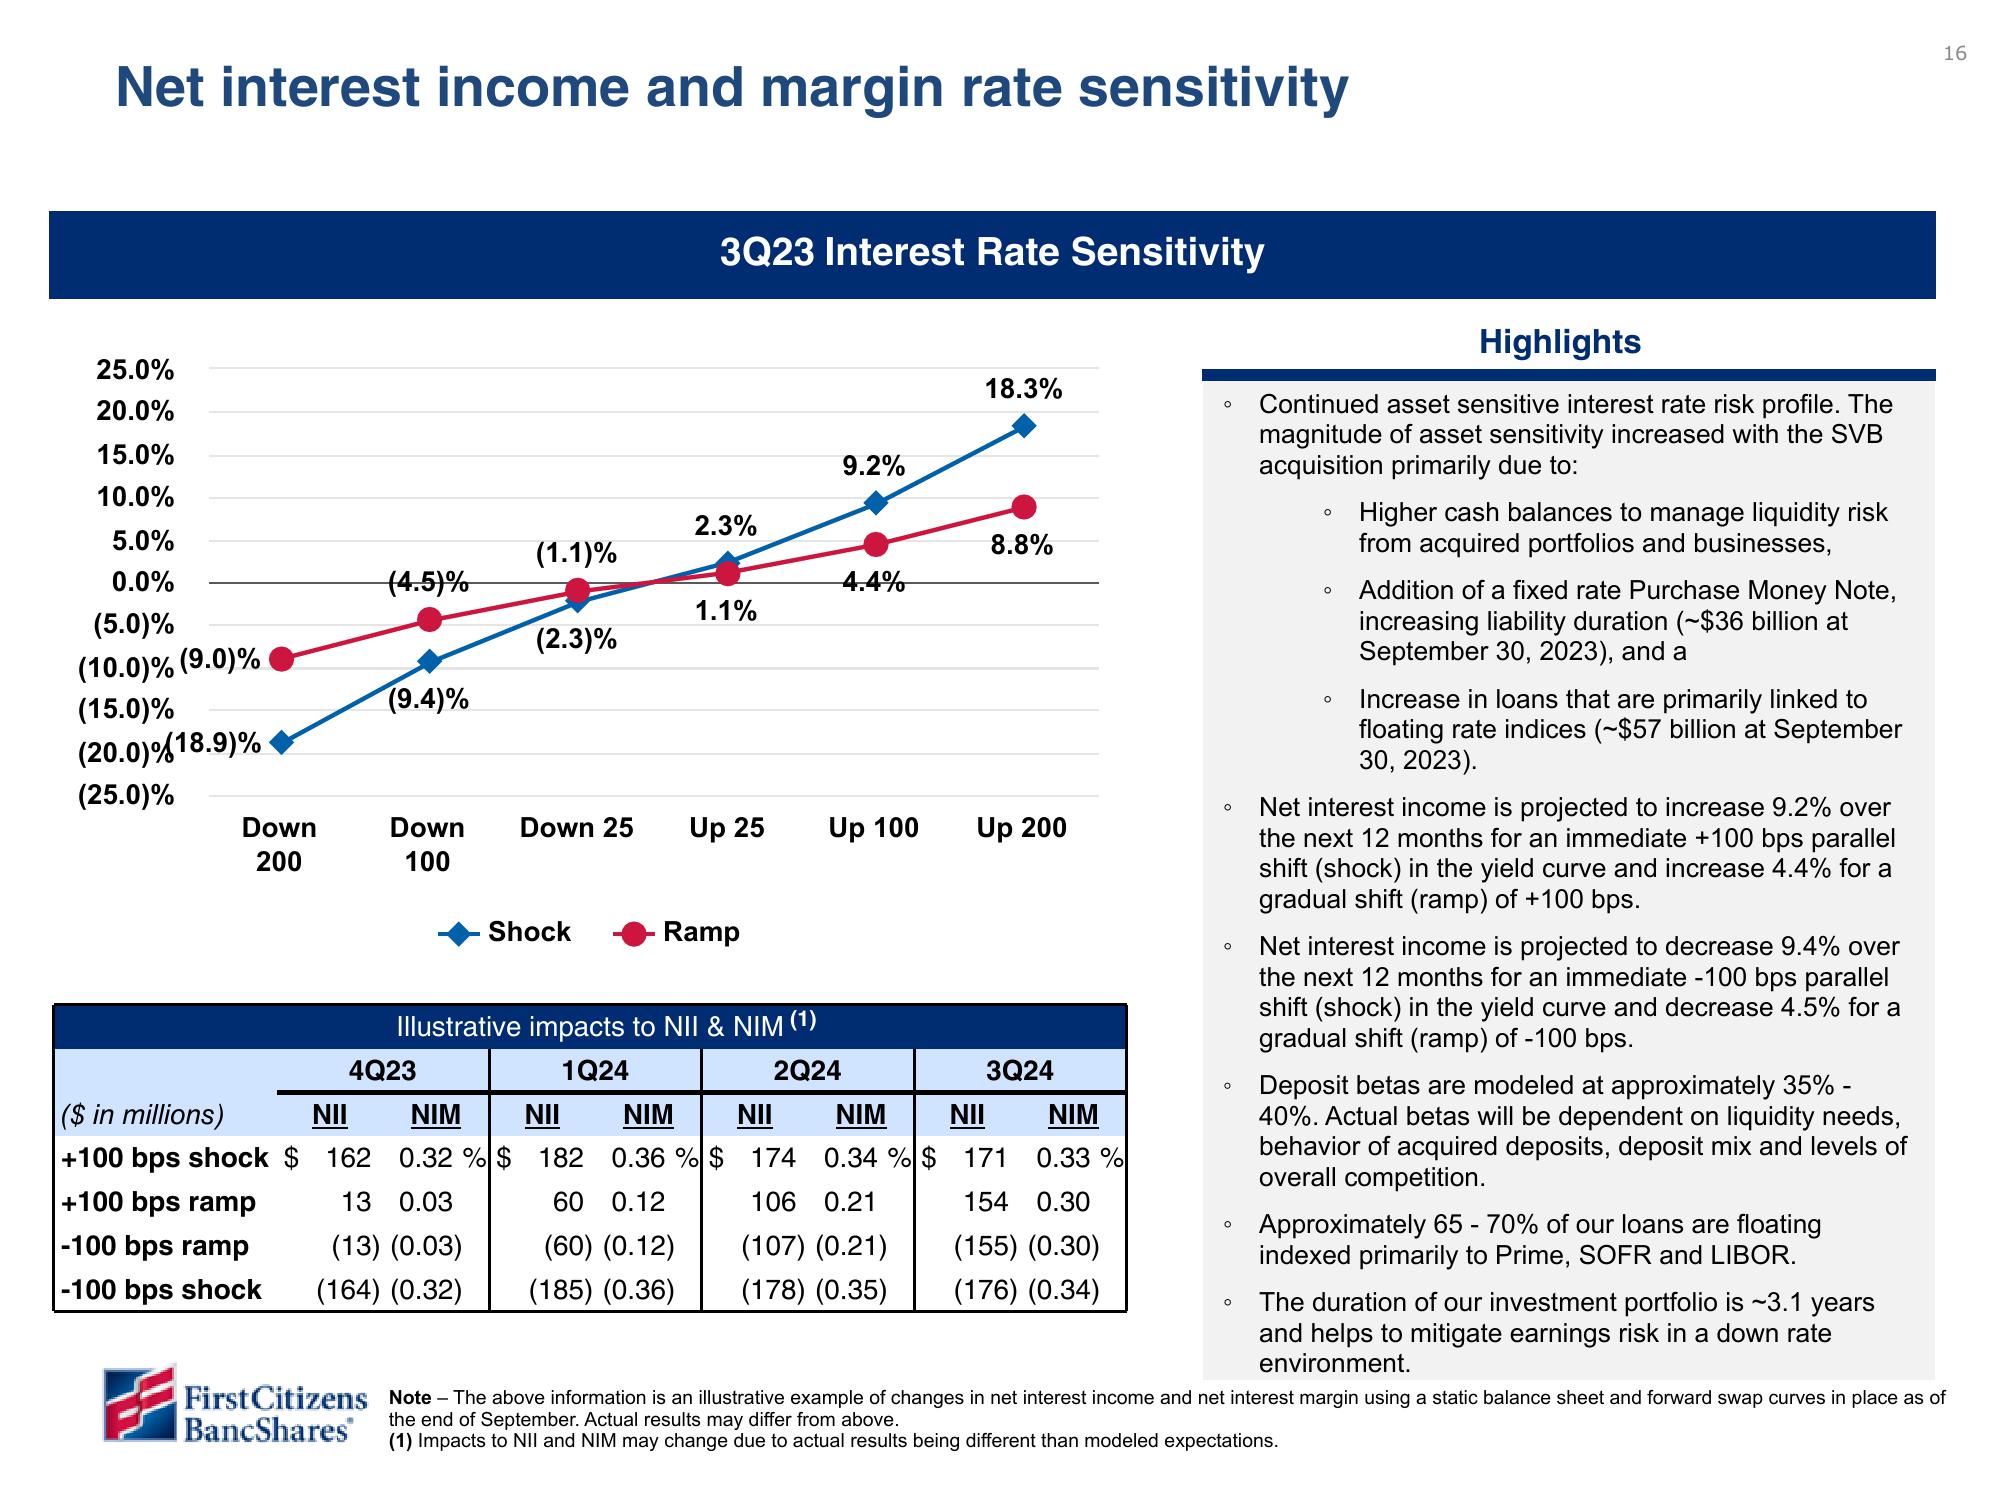
Net interest income is projected to increase 9.2% over
the next 12 months for an immediate +100 bps parallel
shift (shock) in the yield curve and increase 4.4% for a
gradual shift (ramp) of +100 bps.
Net interest income is projected to decrease 9.4% over
the next 12 months for an immediate -100 bps parallel
shift (shock) in the yield curve and decrease 4.5% for a
gradual shift (ramp) of -100 bps.
Deposit betas are modeled at approximately 35% -
40%. Actual betas will be dependent on liquidity needs,
behavior of acquired deposits, deposit mix and levels of
overall competition.
Approximately 65 - 70% of our loans are floating
indexed primarily to Prime, SOFR and LIBOR.
16
The duration of our investment portfolio is ~3.1 years
and helps to mitigate earnings risk in a down rate
environment.
First Citizens Note - The above information is an illustrative example of changes in net interest income and net interest margin using a static balance sheet and forward swap curves in place as of
BancShares
the end of September. Actual results may differ from above.
(1) Impacts to NII and NIM may change due to actual results being different than modeled expectations.View entire presentation