J.P.Morgan Results Presentation Deck
JPMORGAN CHASE & CO.
CREDIT-RELATED INFORMATION, CONTINUED
(in millions, except ratio data)
NONPERFORMING ASSETS (a)(b)
Consumer nonaccrual loans
Loans retained
Loans held-for-sale and loans at fair value
Total consumer nonaccrual loans
Wholesale nonaccrual loans
Loans retained
Loans held-for-sale and loans at fair value
Total wholesale nonaccrual loans
Total nonaccrual loans (c)
Derivative receivables
Assets acquired in loan satisfactions
Total nonperforming assets
Wholesale lending-related commitments (d)
Total nonperforming exposure
NONACCRUAL LOAN-RELATED RATIOS (b)
Total nonaccrual loans to total loans
Total consumer, excluding credit card nonaccrual loans to
total consumer, excluding credit card loans
Total wholesale nonaccrual loans to total
wholesale loans
$
$
Jun 30,
2022
4,186
486
4,672
2,083
407
2,490
7,162
447
236
7,845
397
8,242
0.65 %
1.47
0.40
Mar 31,
2022
4,485
525
5,010
2,289
459
2,748
7,758
597
250
8,605
767
$ 9,372
0.72%
1.60
0.45
Dec 31,
2021
4,878
472
5,350
2,054
391
2,445
7,795
316
235
8,346
764
$ 9,110
0.72%
1.65
0.41
JPMORGAN CHASE & CO.
$
Sep 30,
2021
4,911
440
5,351
2,084
808
2,892
8,243
393
246
8,882
641
$ 9,523
0.79%
1.63
0.50
$
$
Jun 30,
2021
5,183
475
5,658
2,698
716
3,414
9,072
481
249
9,802
851
10,653
0.87%
1.72
0.60
Jun 30, 2022
Change
Mar 31,
2022
(7)%
(7)
(7)
(9)
(11)
(9)
(8)
(25)
(6)
(9)
(48)
(12)
Jun 30,
2021
(19)%
2
(17)
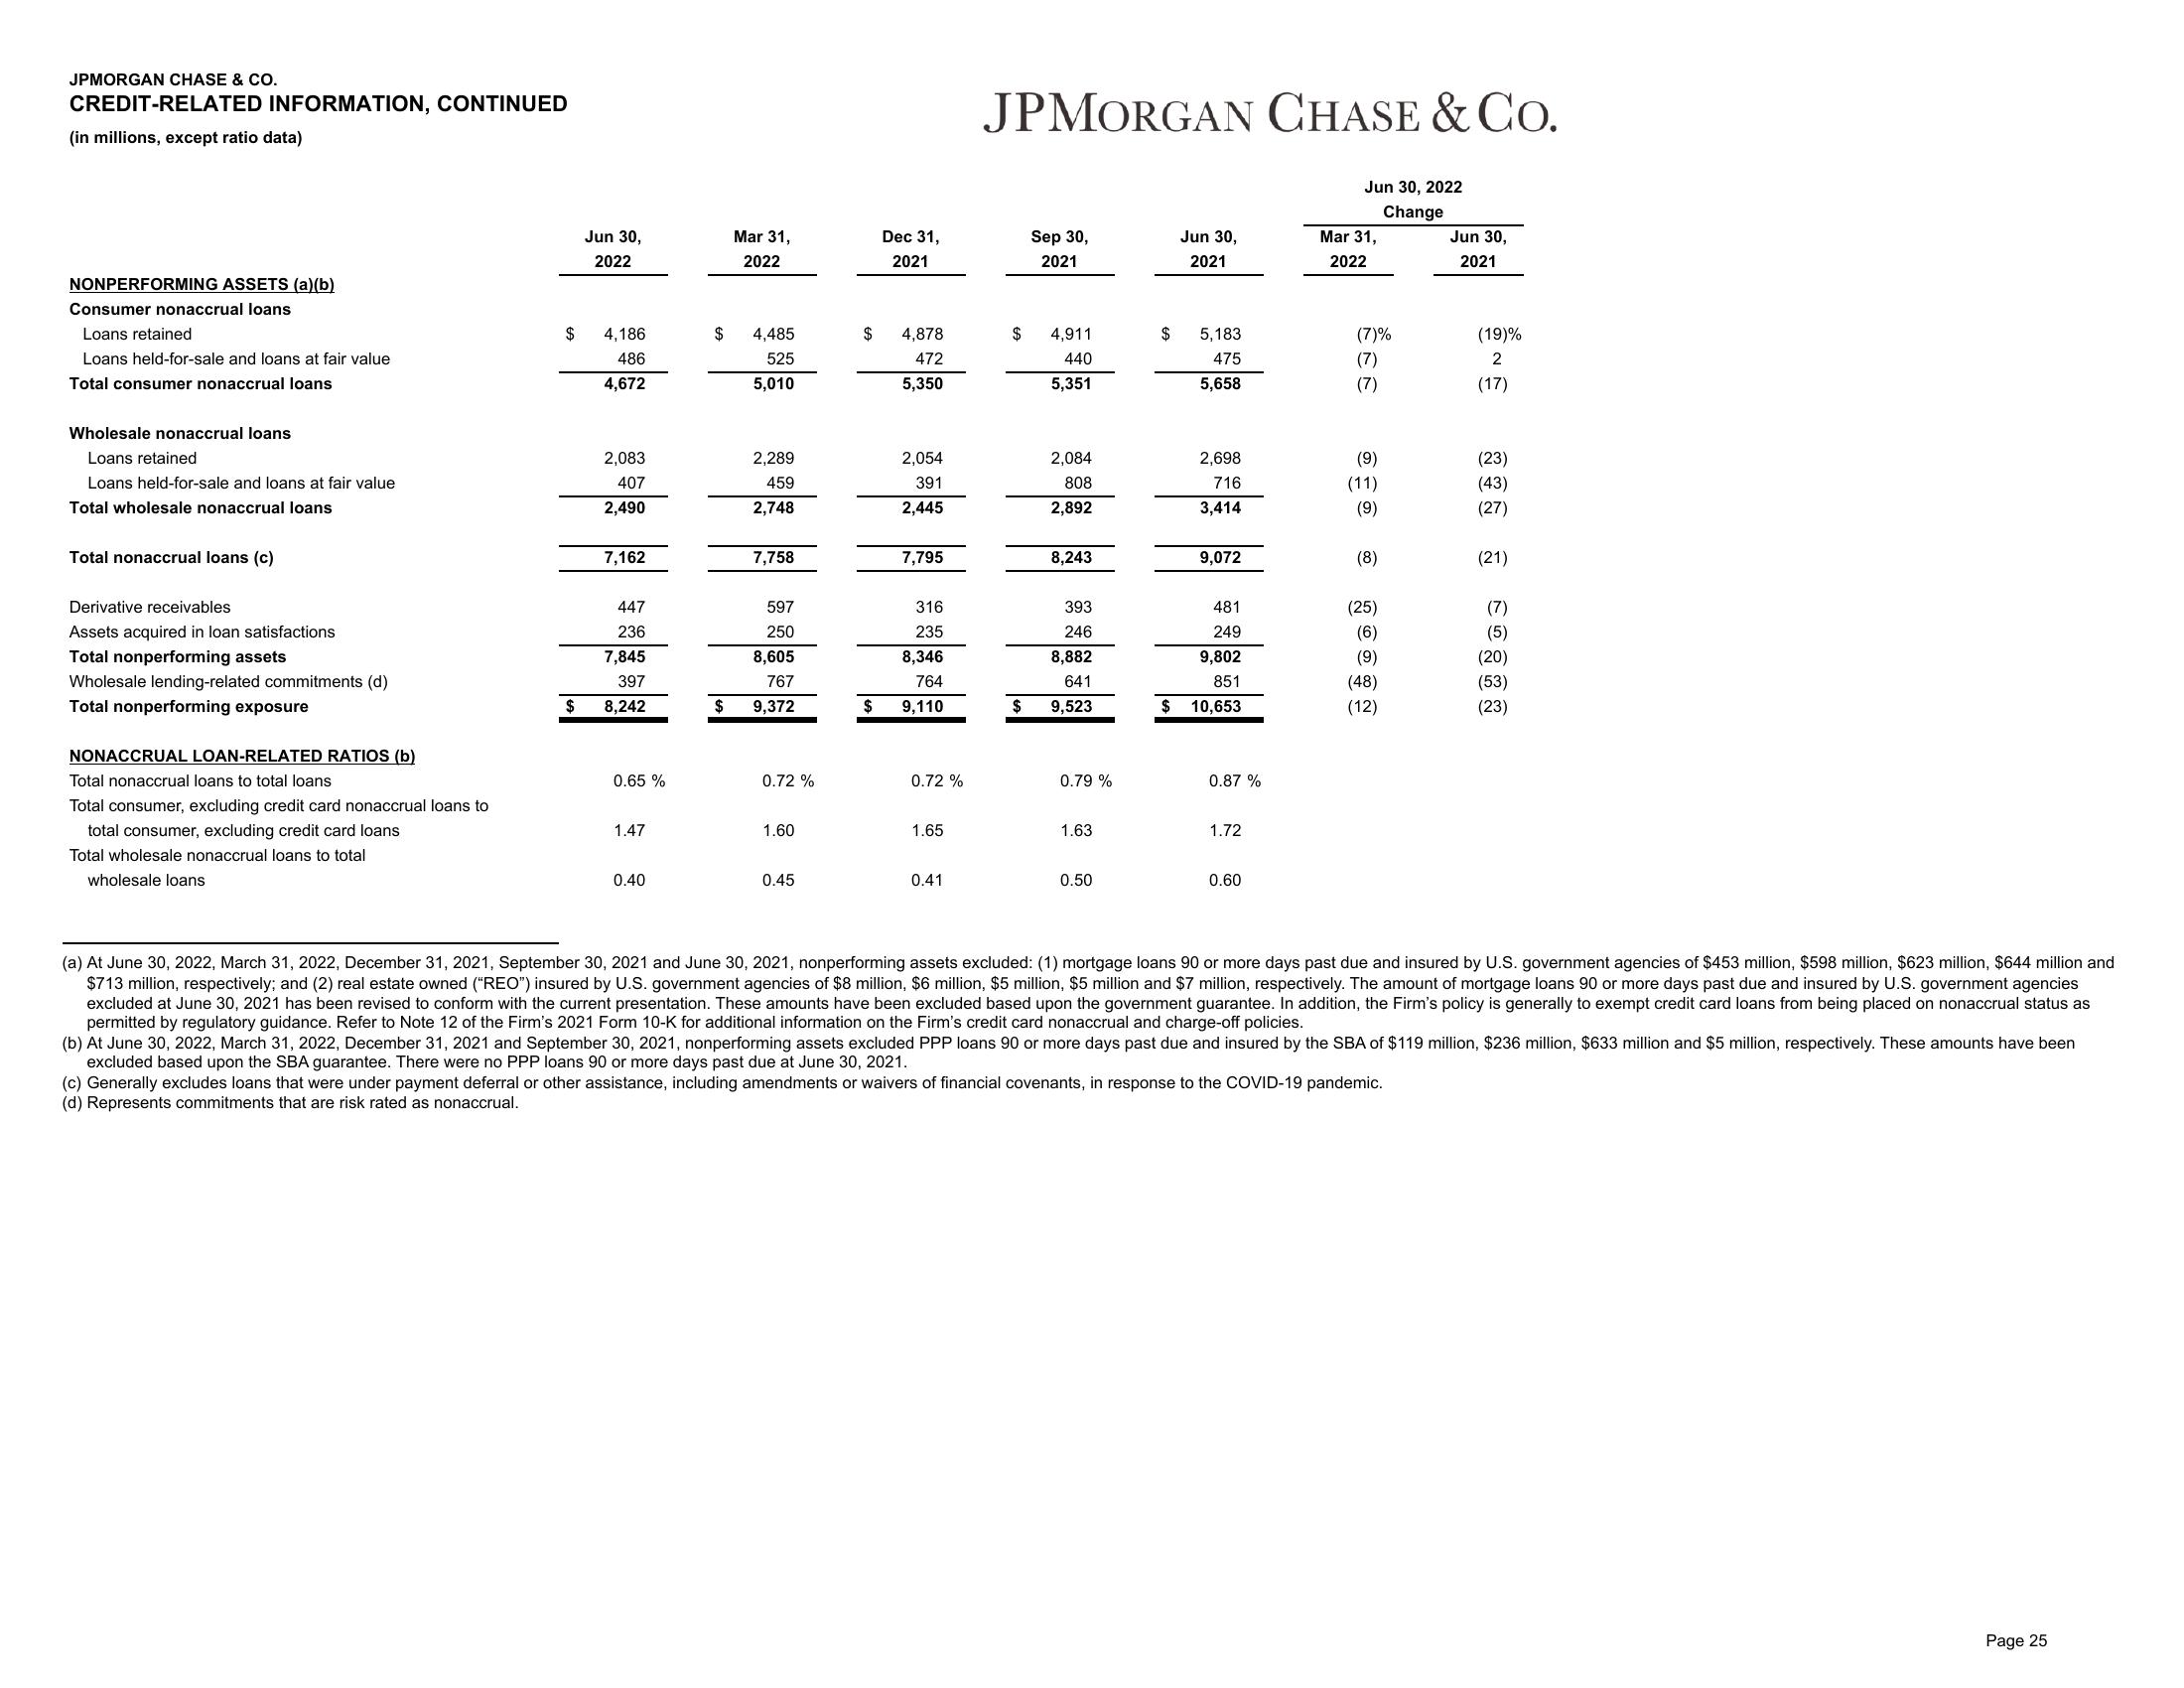
(c) Generally excludes loans that were under payment deferral or other assistance, including amendments or waivers of financial covenants, in response to the COVID-19 pandemic.
(d) Represents commitments that are risk rated as nonaccrual.
(23)
(43)
(27)
(21)
(7)
(5)
(20)
(53)
(23)
(a) At June 30, 2022, March 31, 2022, December 31, 2021, September 30, 2021 and June 30, 2021, nonperforming assets excluded: (1) mortgage loans 90 or more days past due and insured by U.S. government agencies of $453 million, $598 million, $623 million, $644 million and
$713 million, respectively; and (2) real estate owned ("REO") insured by U.S. government agencies of $8 million, $6 million, $5 million, $5 million and $7 million, respectively. The amount of mortgage loans 90 or more days past due and insured by U.S. government agencies
excluded at June 30, 2021 has been revised to conform with the current presentation. These amounts have been excluded based upon the government guarantee. In addition, the Firm's policy is generally to exempt credit card loans from being placed on nonaccrual status as
permitted by regulatory guidance. Refer to Note 12 of the Firm's 2021 Form 10-K for additional information on the Firm's credit card nonaccrual and charge-off policies.
(b) At June 30, 2022, March 31, 2022, December 31, 2021 and September 30, 2021, nonperforming assets excluded PPP loans 90 or more days past due and insured by the SBA of $119 million, $236 million, $633 million and $5 million, respectively. These amounts have been
excluded based upon the SBA guarantee. There were no PPP loans 90 or more days past due at June 30, 2021.
Page 25View entire presentation