Credit Suisse Investment Banking Pitch Book
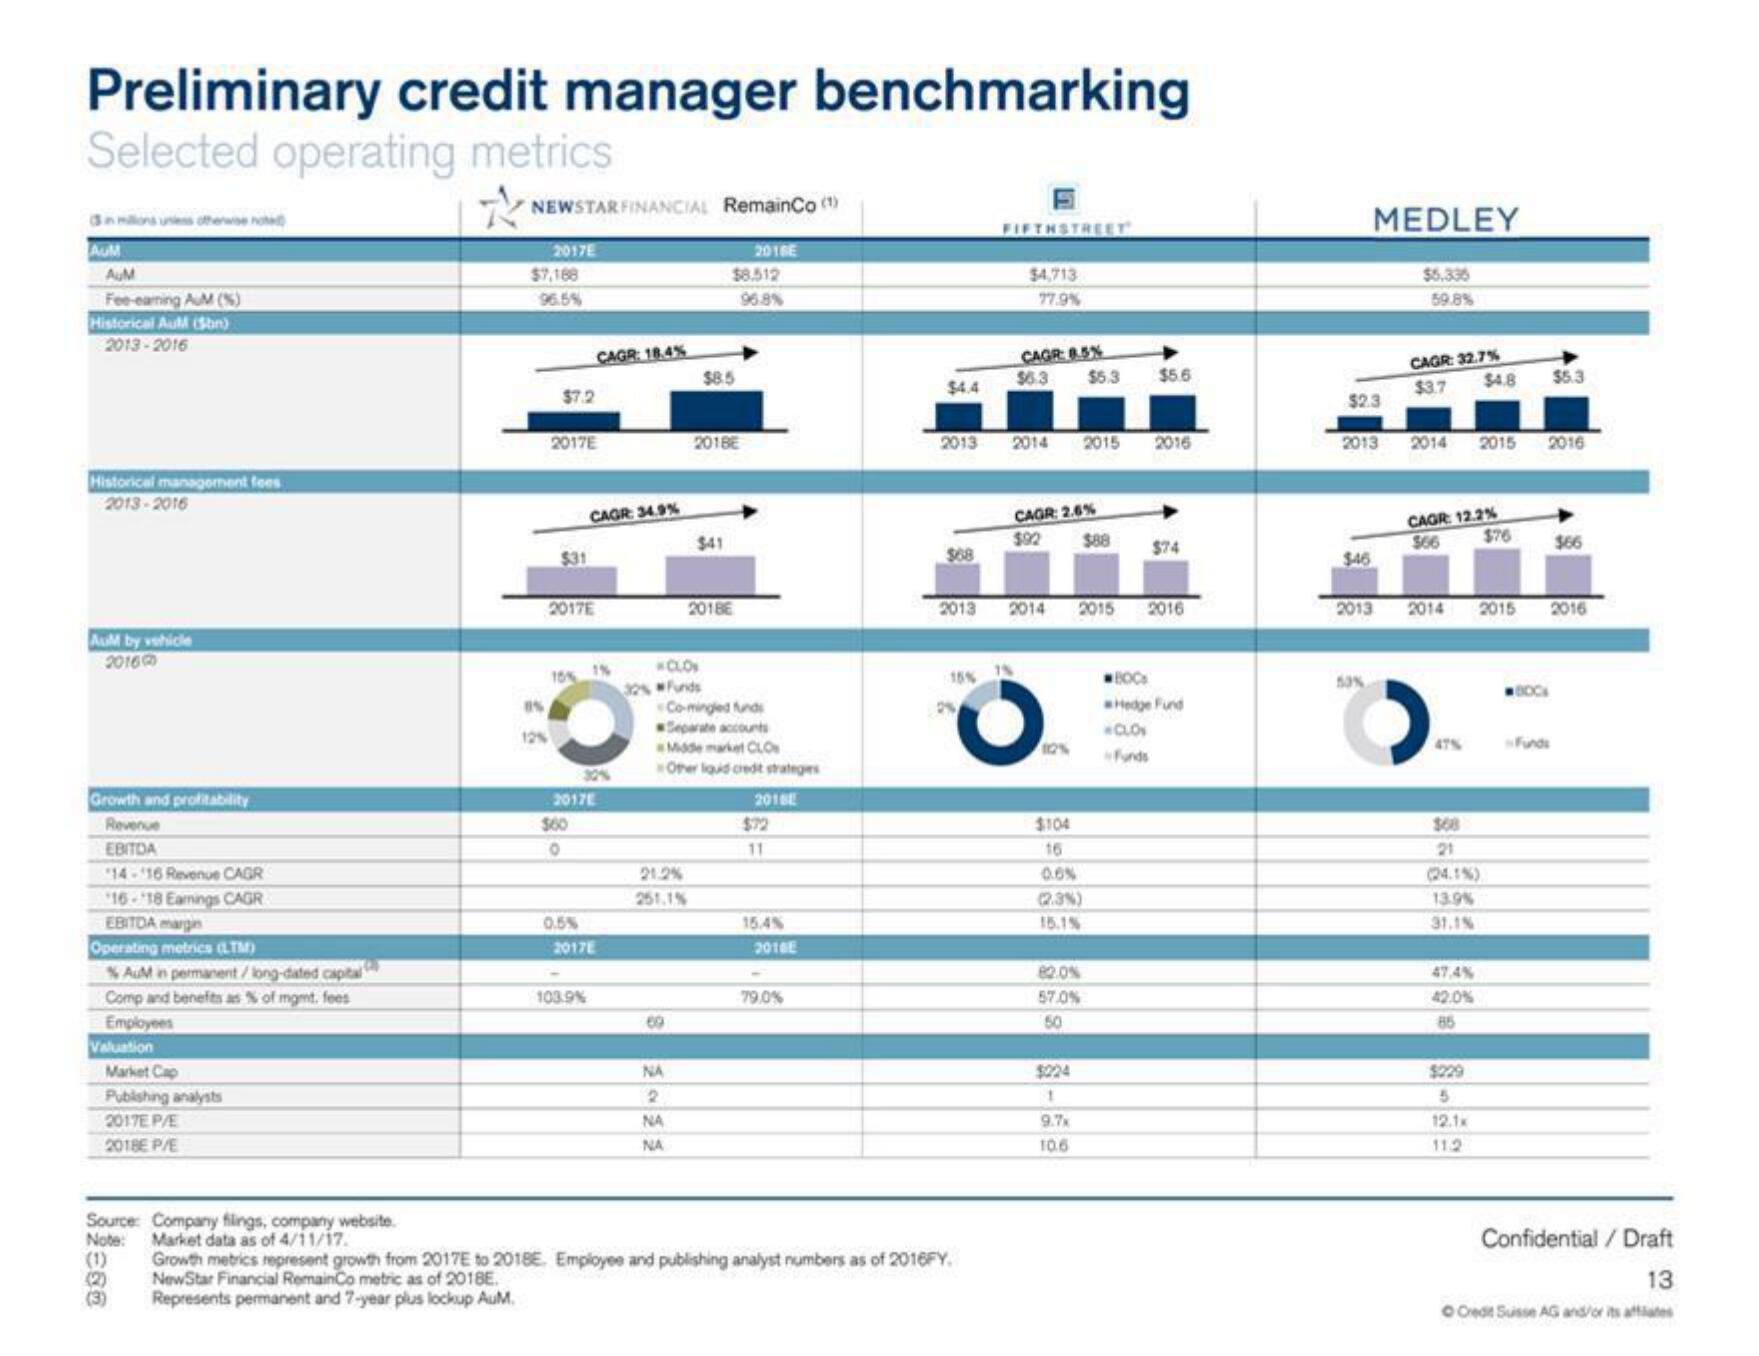
Preliminary credit manager benchmarking
Selected operating metrics
NEWSTAR FINANCIAL RemainCo (¹)
AUM
AUM
Fee-eaming AuM (%)
Historical AuM (bn)
2013-2016
Historical management fees
2013-2016
AuM by vehicle
2016
Growth and profitability
Revenue
EBITDA
14-16 Revenue CAGR
16-18 Earnings CAGR
EBITDA margin
Operating metrics (LTM)
% AuM in permanent/long-dated capital
Comp and benefits as % of mgmt. fees
Employees
Valuation
Market Cap
Publishing analysts
2017E P/E
2018EP/E
Source: Company filings, company website.
Note: Market data as of 4/11/17.
(1)
(2)
(3)
2017E
$7,168
96.5%
05
12%
$7.2
2017E
$31
2017E
16% 1%
2017E
O
CAGR: 18.4%
CAGR: 34.9%
0.5%
103.9%
2017E
69
21.2%
251.1%
CLO
NA
2
NA
NA
$8.512
96.8%
$8.5
2018E
2018E
2016E
Co-mingled funds
Separate accounts
Midde market CLO
Other liquid credit strateges
2018E
$72
11
15.4%
2016E
79.0%
2013
$68
2013
15%
2%
Growth metrics represent growth from 2017E to 2018E. Employee and publishing analyst numbers as of 2016FY.
NewStar Financial RemainCo metric as of 2018E.
Represents permanent and 7-year plus lockup AuM.
FIFTHSTREET
$4,713
77.9%
CAGR: 8.5%
$6.3 $5.3
2014
18
CAGR: 2.6%
$92 $88
$104
2014 2015 2016
16
0.6%
(2.3%)
15.1%
82.0%
57.0%
50
2015
$224
1
9.7x
10.6
$5.6
2016
$74
600s
Hedge Fund
CLOS
Funds
$46
MEDLEY
$6.336
59.8%
$2.3
2013 2014 2015 2016
50%
CAGR: 32.7%
$4.8 $5.3
$3.7
CAGR: 12.2%
$76
$66
2013 2014 2015 2016
47%
168
21
(24.1%
13.9%
31,1%
47.4%
42.0%
85
5
12.1x
BOCK
$66
Funds
Confidential / Draft
13
O Credit Suisse AG and/or its affiliatesView entire presentation