Hertz Investor Presentation Deck
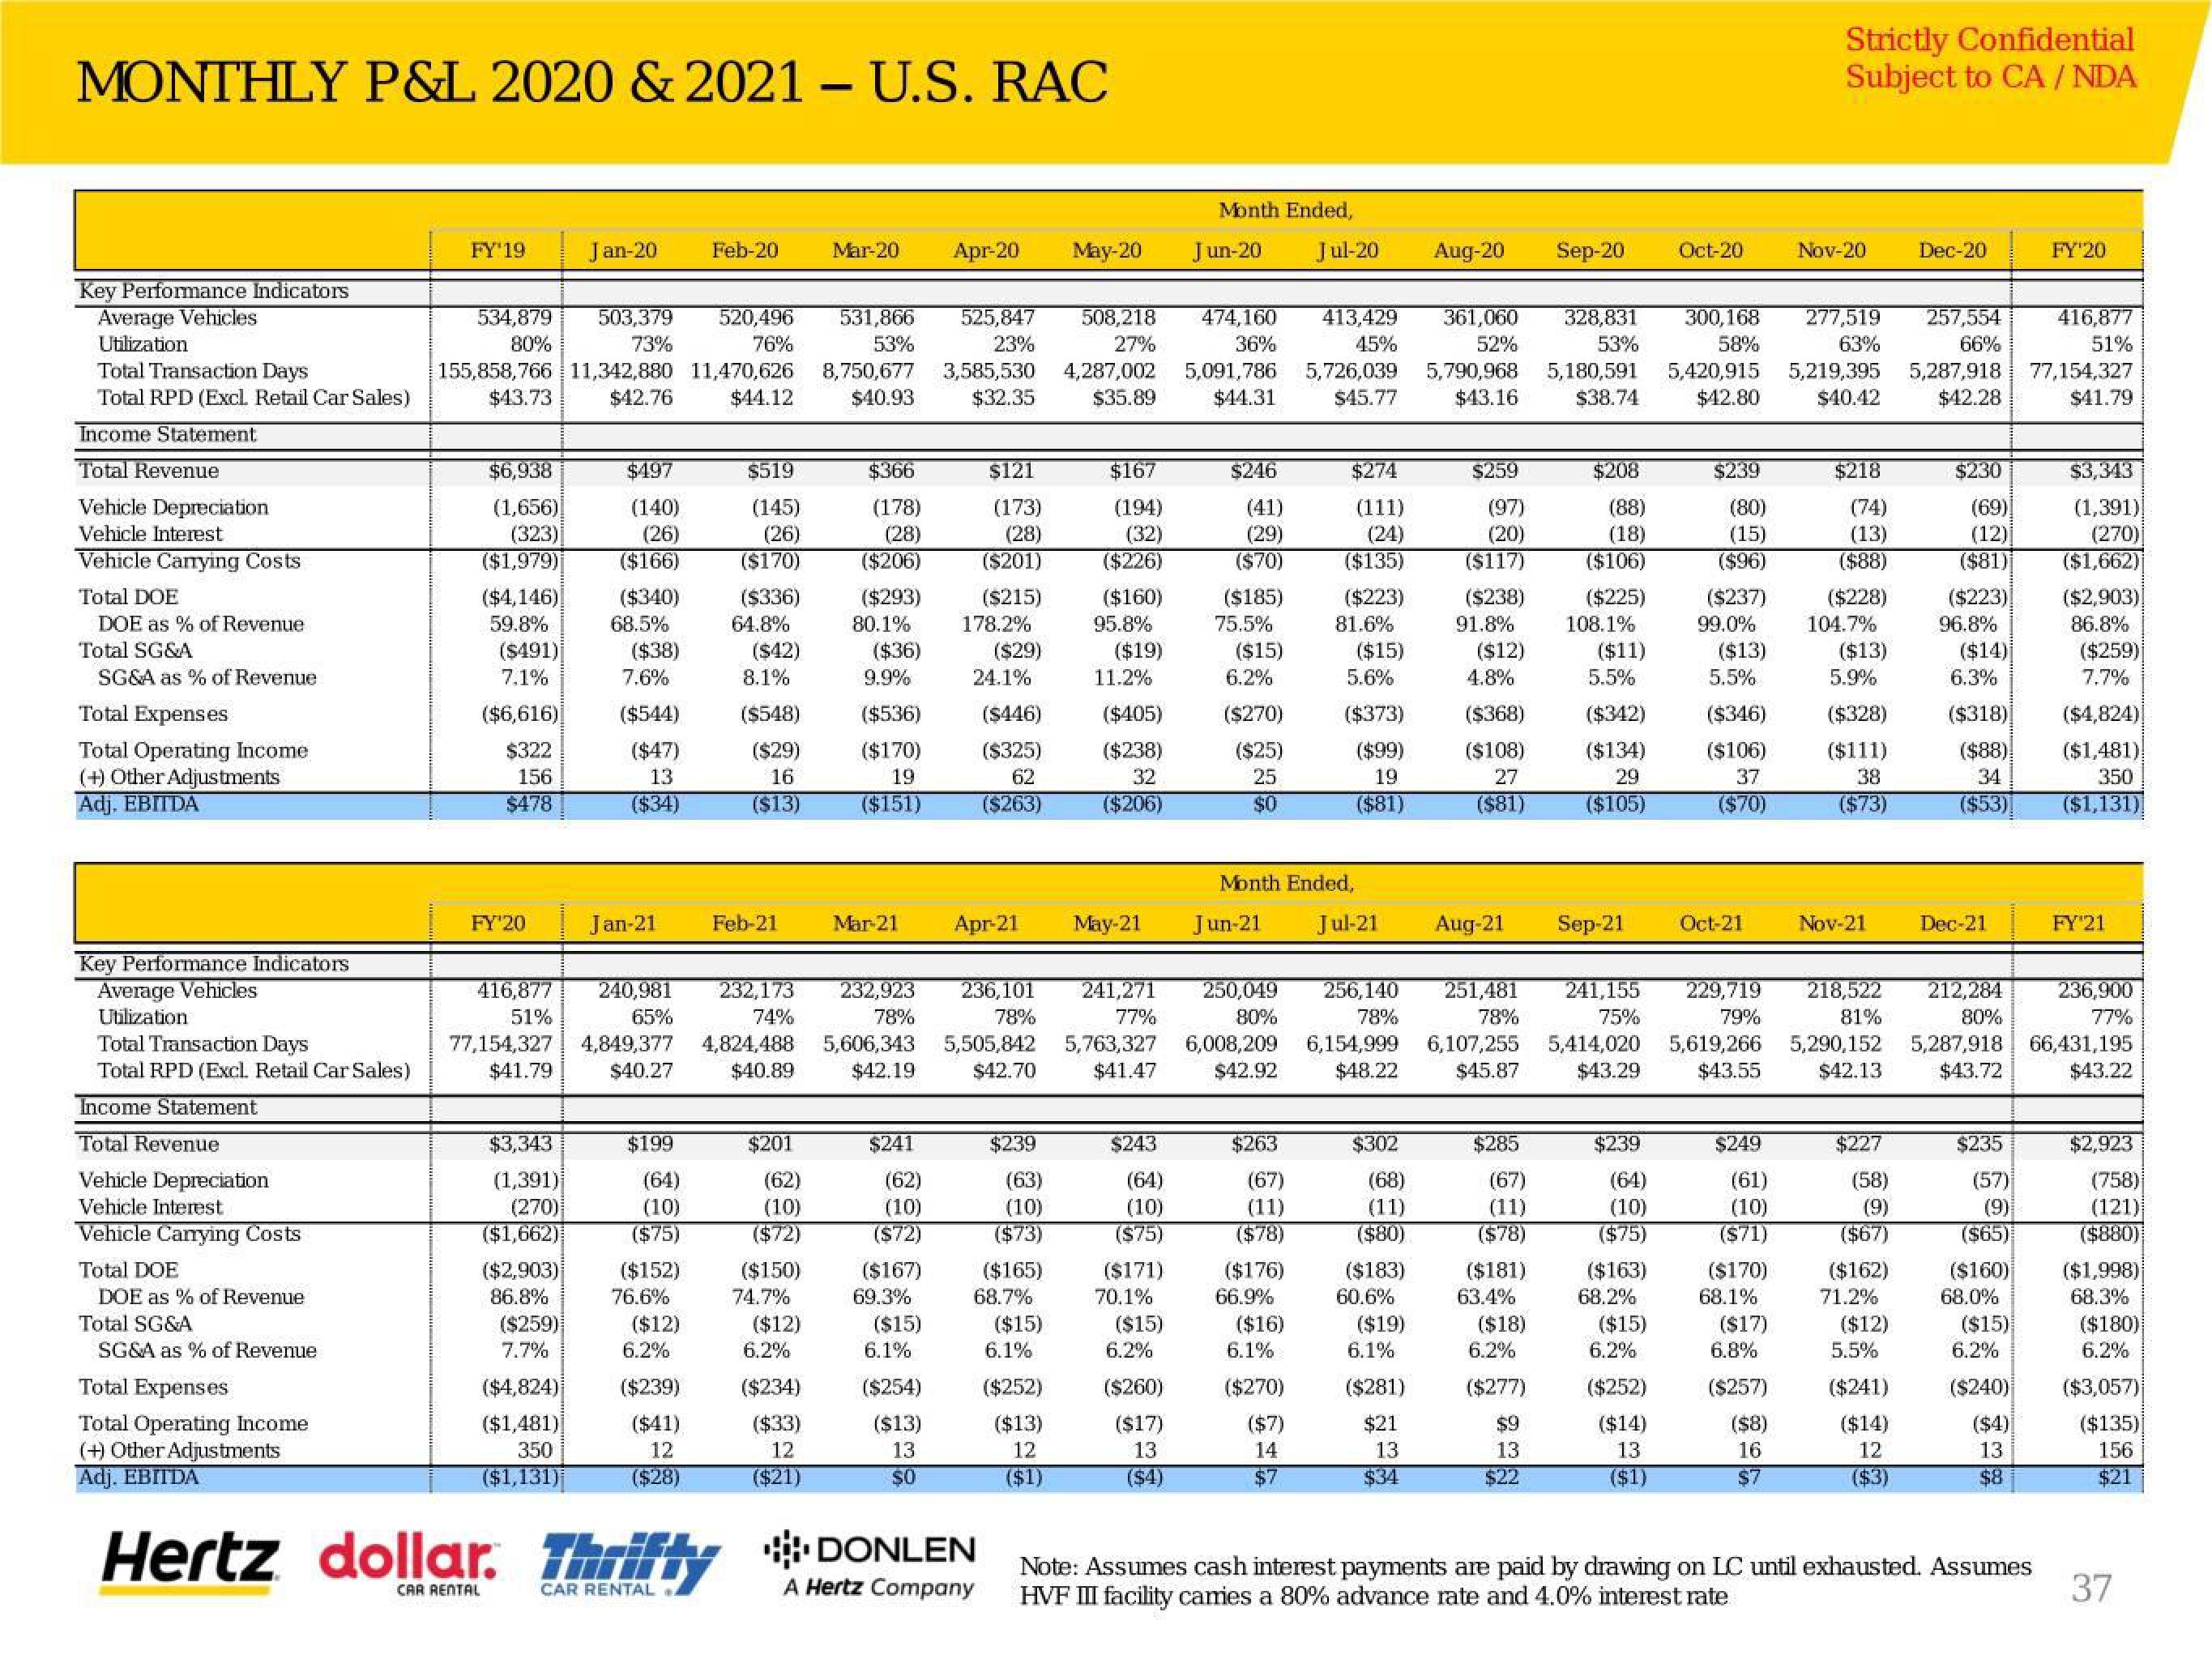
MONTHLY P&L 2020 & 2021 - U.S. RAC
Key Performance Indicators
Average Vehicles
Utilization
Total Transaction Days
Total RPD (Excl. Retail Car Sales)
Income Statement
Total Revenue
Vehicle Depreciation
Vehicle Interest
Vehicle Carrying Costs
Total DOE
DOE as % of Revenue
Total SG&A
SG&A as % of Revenue
Total Expenses
Total Operating Income
(+) Other Adjustments
Adj. EBITDA
FY'19
534,879
80%
$6,938
(1,656)
(323)
($1,979)
503,379 520,496 531,866
73%
76%
53%
155,858,766 11,342,880 11,470,626 8,750,677
$43.73 $42.76 $44.12 $40.93
($4,146)
59.8%
($491)
7.1%
($6,616)
$322
156
$478
FY'20
416,877
51%
77,154,327
$41.79
$3,343
(1,391)
(270)
($1,662)
($2,903)
86.8%
($259)
7.7%
($4,824)
($1,481)
350
($1,131)
Jan-20
Hertz dollar.
$497
(140)
(26)
($166)
($340)
68.5%
($38)
7.6%
($544)
($47)
13
($34)
$199
(64)
(10)
($75)
($152)
Feb-20
76.6%
Jan-21 Feb-21
($12)
$519
(145)
(26)
($170)
6.2%
($239)
($41)
12
($28)
($336)
64.8%
($42)
8.1%
($548)
($29)
16
($13)
$201
(62)
(10)
($72)
($150)
74.7%
($12)
Mar-20 Apr-20
6.2%
($234)
($33)
12
($21)
$366
(178)
(28)
($206)
240,981 232,173 232,923 236,101
65%
74%
78%
78%
4,849,377 4,824,488 5,606,343 5,505,842
$40.27 $40.89 $42.19 $42.70
($293)
80.1%
($36)
9.9%
($536)
($170)
19
($151)
$241
(62)
(10)
($72)
($167)
69.3%
($15)
Mar-21 Apr-21
6.1%
($254)
($13)
13
$0
525,847 508,218 474,160
23%
27%
36%
3,585,530 4,287,002 5,091,786
$32.35 $35.89 $44.31
$121
(173)
(28)
($201)
($215)
178.2%
($29)
24.1%
dollar. Thrifty DONLEN
CAR RENTAL
CAR RENTAL
A Hertz Company
($446)
($325)
62
($263)
$239
(63)
(10)
($73)
($165)
68.7%
($15)
6.1%
May-20
($252)
($13)
12
($1)
$167
(194)
(32)
($226)
($160)
95.8%
($19)
11.2%
($405)
($238)
32
($206)
May-21
$243
(64)
(10)
($75)
($171)
70.1%
($15)
Month Ended,
Jun-20 Jul-20 Aug-20 Sep-20 Oct-20
6.2%
($260)
($17)
13
($4)
$246
(41)
(29)
($70)
($185)
75.5%
($15)
6.2%
($270)
($25)
25
$0
$263
(67)
(11)
($78)
($176)
66.9%
($16)
$274
(111)
(24)
($135)
6.1%
($270)
($7)
14
$7
($223)
413,429 361,060 328,831 300,168 277,519 257,554
45%
52%
53%
58%
63%
66%
5,726,039 5,790,968 5,180,591 5,420,915 5,219,395 5,287,918
$45.77 $43.16 $38.74
$42.80
$40.42
$42.28
81.6%
($15)
Month Ended,
Jun-21 Jul-21 Aug-21
5.6%
($373)
($99)
19
($81)
$302
(68)
(11)
($80)
($183)
60.6%
($19)
$259
(97)
(20)
($117)
($238)
6.1%
91.8%
($281)
$21
13
$34
($12)
4.8%
($368)
($108)
27
($81)
$285
(67)
(11)
($78)
($181)
63.4%
($18)
6.2%
($277)
$208
(88)
(18)
($106)
241,271 250,049 256,140 251,481 241,155 229,719 218,522 212,284 236,900
77%
80%
78%
78%
75%
79%
81%
80%
77%
5,763,327 6,008,209 6,154,999 6,107,255 5,414,020 5,619,266 5,290,152 5,287,918 66,431,195
$41.47 $42.92 $48.22 $45.87 $43.29 $43.55
$42.13
$43.72
$43.22
$9
13
$22
($225)
108.1%
Sep-21
($11)
5.5%
($13)
5.5%
($342)
($346)
($134) ($106)
29
37
($70)
($105)
$239
(64)
(10)
($75)
($163)
68.2%
($15)
$239
(80)
(15)
($96)
($237)
6.2%
99.0%
($252)
($14)
13
($1)
Oct-21
$249
(61)
(10)
($71)
($170)
68.1%
Strictly Confidential
Subject to CA/ NDA
($17)
Nov-20
6.8%
($257)
($8)
16
$7
$218
(74)
(13)
($88)
($228)
104.7%
($13)
5.9%
($328)
($111)
38
($73)
Nov-21
$227
(58)
(9)
($67)
($162)
71.2%
($12)
Dec-20
5.5%
($241)
($14)
12
($3)
$230
(69)
(12)
($81)
($223)
96.8%
($14)
6.3%
($318)
($88)
34
($53)
Dec-21
$235
(57)
(9)
($65)
($160)
68.0%
($15)
6.2%
($240)
($4)
13
$8
FY'20
416,877
51%
77,154,327
$41.79
Note: Assumes cash interest payments are paid by drawing on LC until exhausted. Assumes
HVF III facility cames a 80% advance rate and 4.0% interest rate
$3,343
(1,391)
(270)
($1,662)
($2,903)
86.8%
($259)
7.7%
($4,824)
($1,481)
350
($1,131)
FY 21
$2,923
(758)
(121)
($880)
($1,998)
68.3%
($180)
6.2%
($3,057)
($135)
156
$21
37View entire presentation